There are two ways to retrieve a statistical chart for basic analysis. It can be used either for a preliminary search result or for a project.
Statistical Chart for a Search Result
Patent Search offers basic analyses based on a variety of data after queries. To use this statistics feature, follow the steps below:
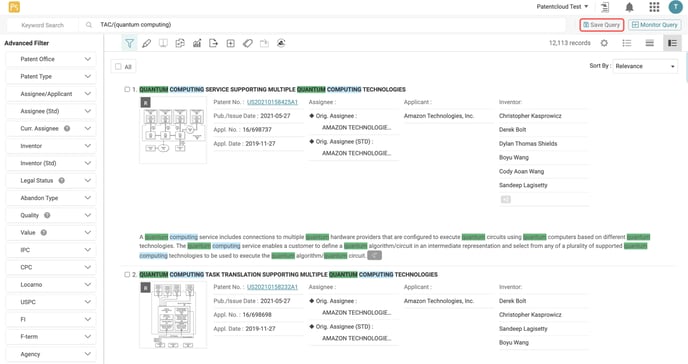
- A result is displayed after a data search.
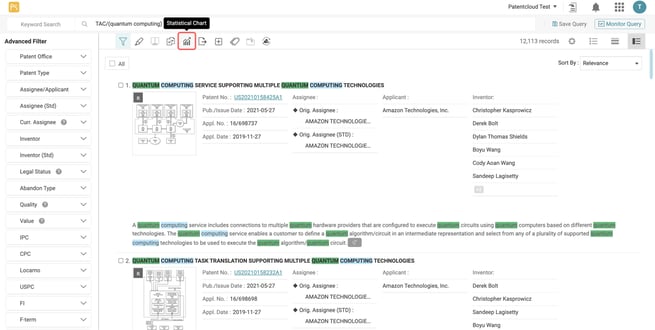
- Clicking on the Statistical Chart button will take the user to the statistics feature.
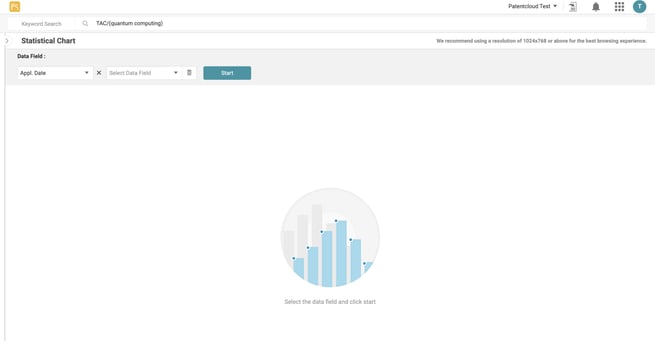
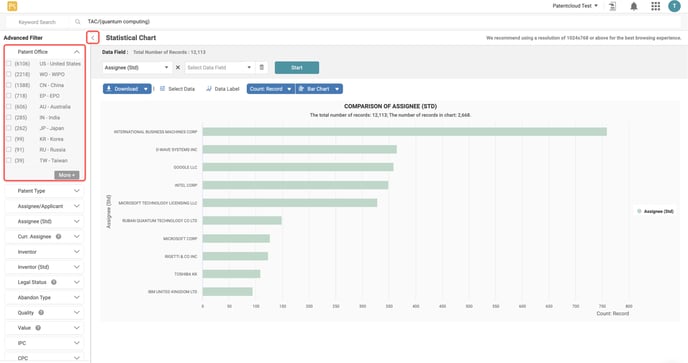
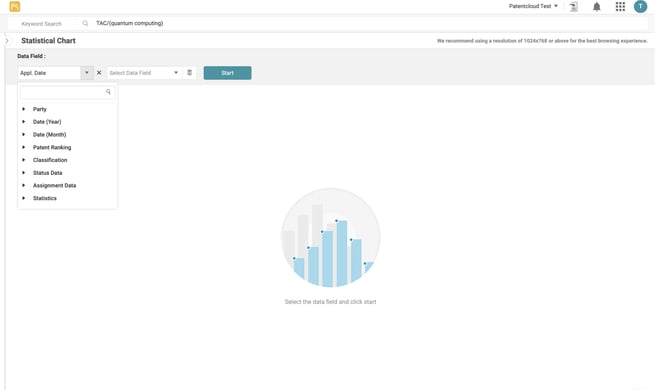
- In the Data Field section, users will see a dropdown menu. Use the dropdown menu to view the data fields available for a statistical chart to be based upon.
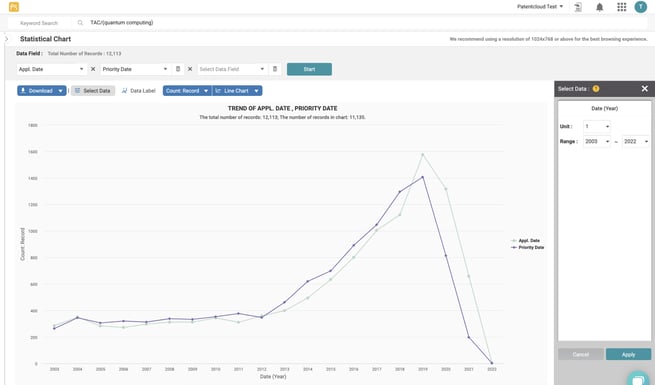
- After selecting the desired data field(s), a statistical chart will be displayed. In this case, two data fields were selected.
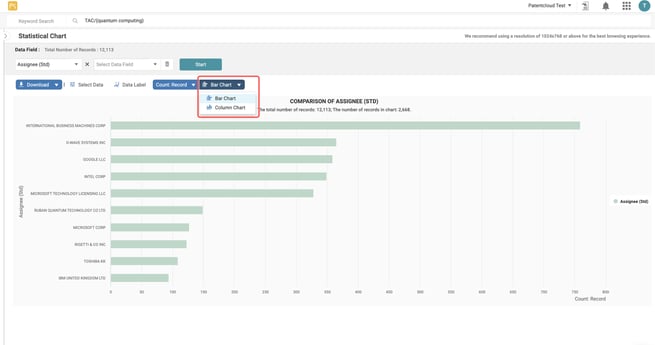
- Viewing charts in other formats (e.g., bar charts) is also possible, but this cannot be done for a time-related data field. Click the Bar Chart button for chart options, and then select the preferred chart format.
- Users can also further narrow down their search by filtering by various parameters. Select the required parameters to filter by (on the left-hand side of the page), and then click on Filter. Click on the Expand to the left icon
 to view the filter panel.