用户有两种方法执行「简易分析」,可以使用于 Patent Search 专利检索结果或是在 Patent Vault 专案中:
检索结果的统计图表
Patent Search 在查询后基于各种数据提供基本分析。按以下步骤操作使用此统计功能:
- 检索结果的页面会在您执行搜寻的动作后显示,如下图。
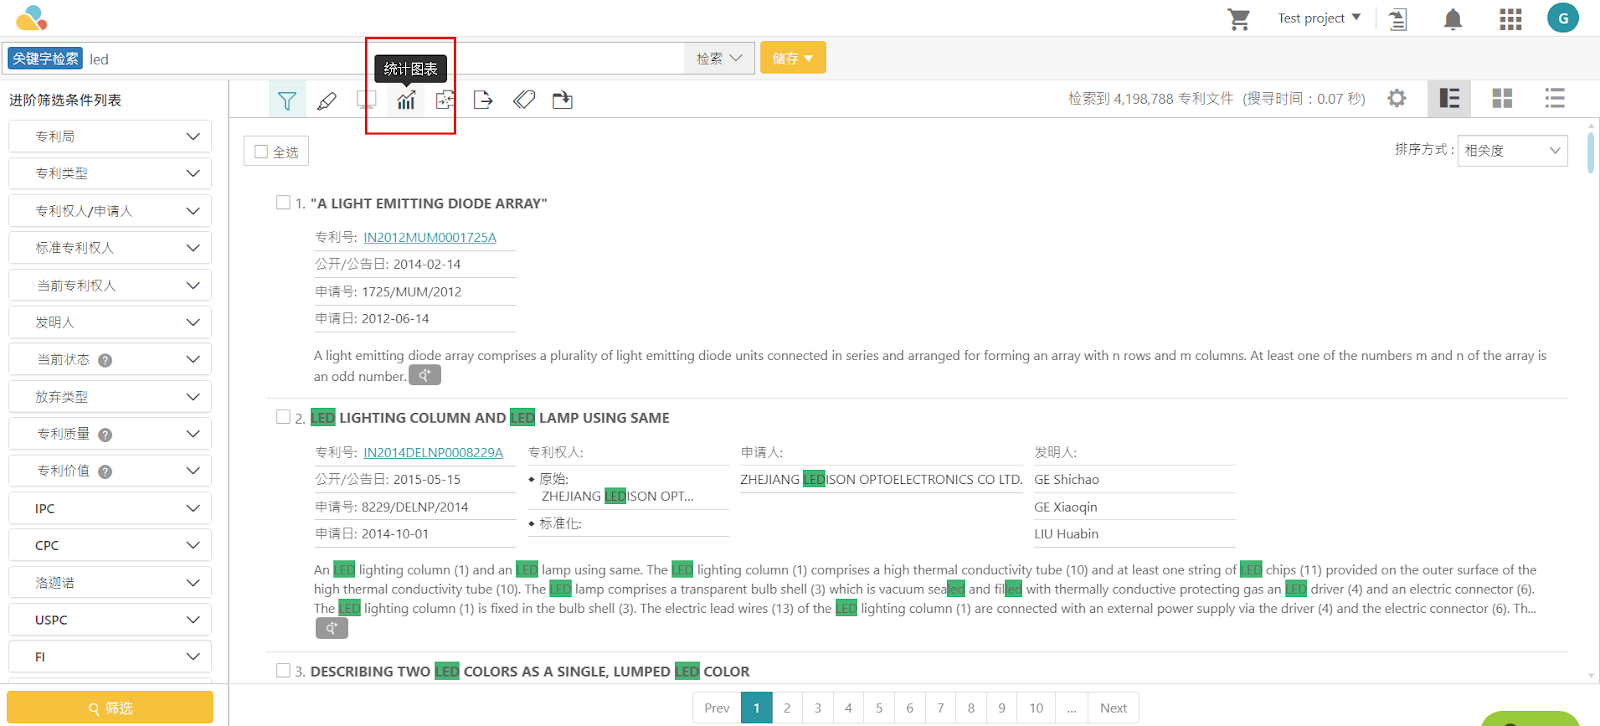
- 按下「统计图表」图示,您会被带到统计功能的页面。
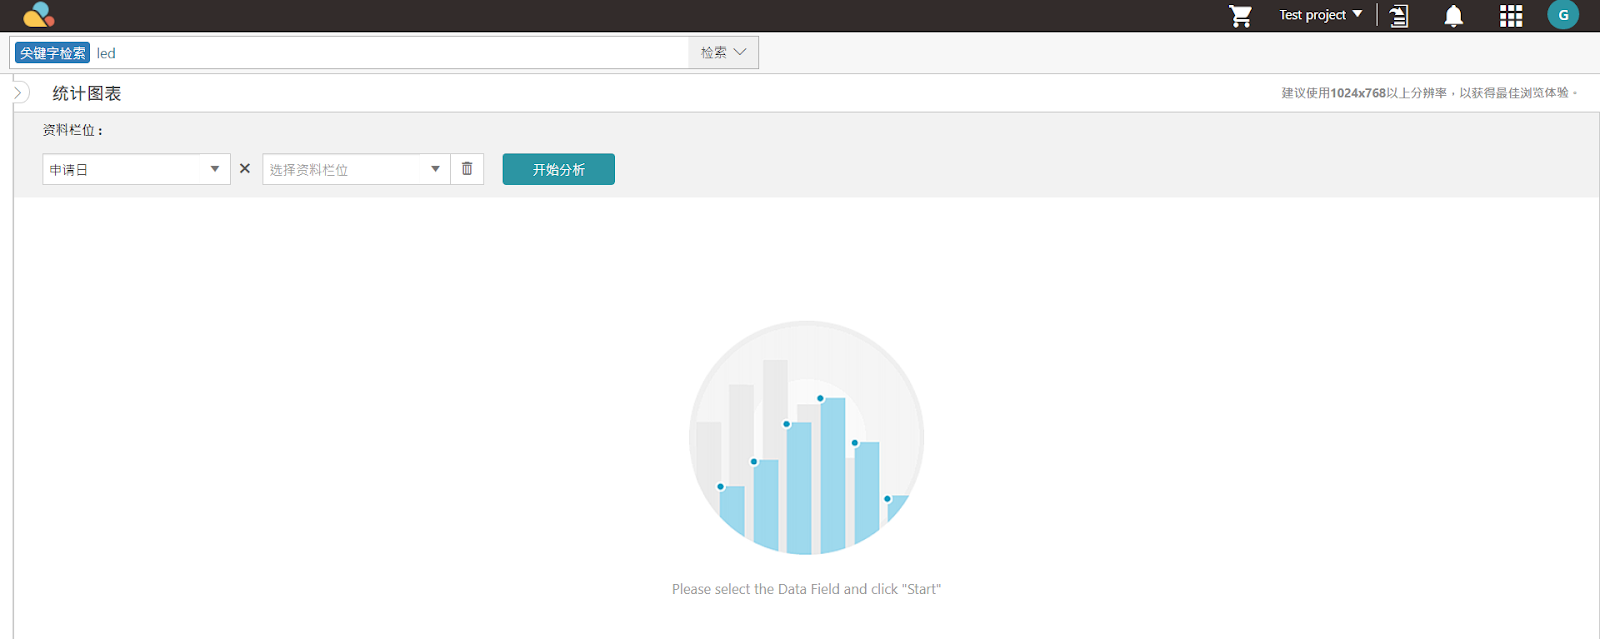
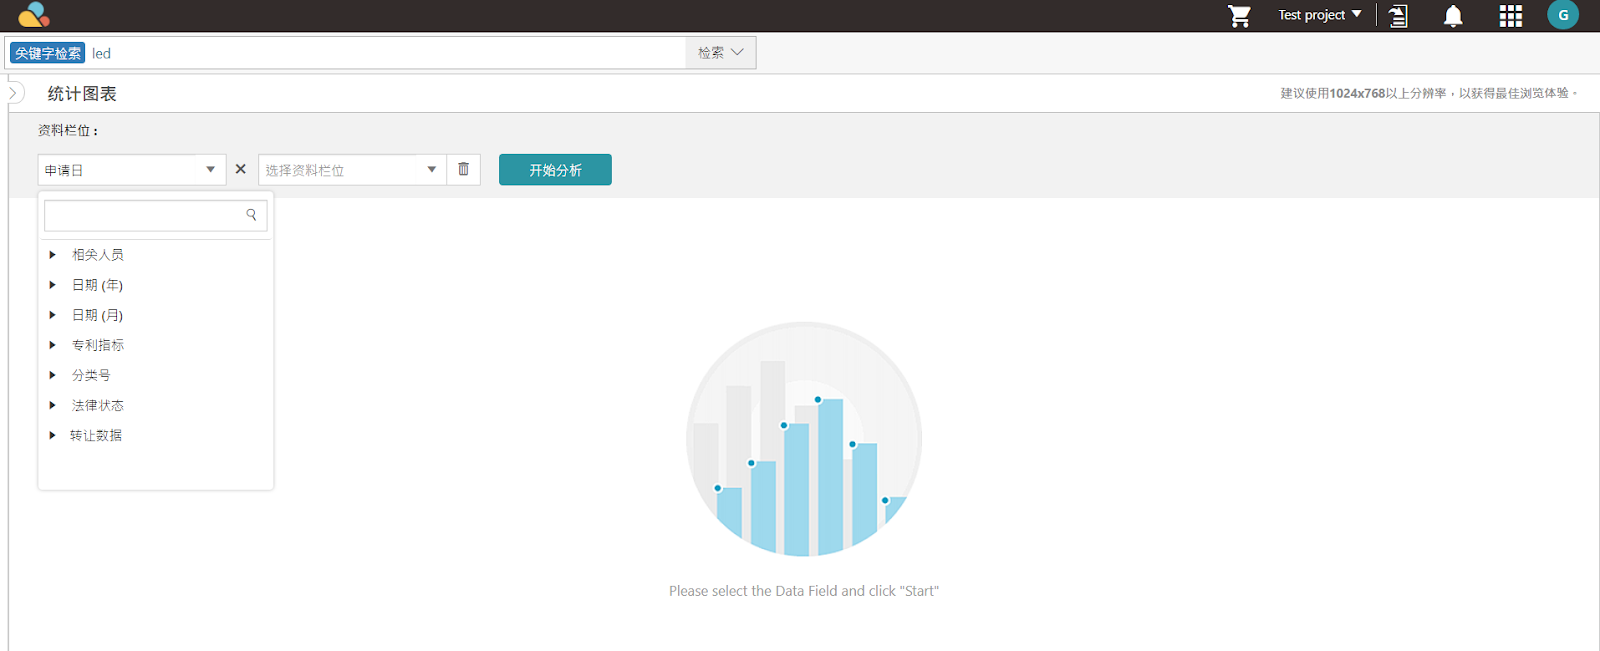
- 在「资料栏位」您可以看到下拉目录,使用此目录选择您想要包含在「统计图表」的项目。
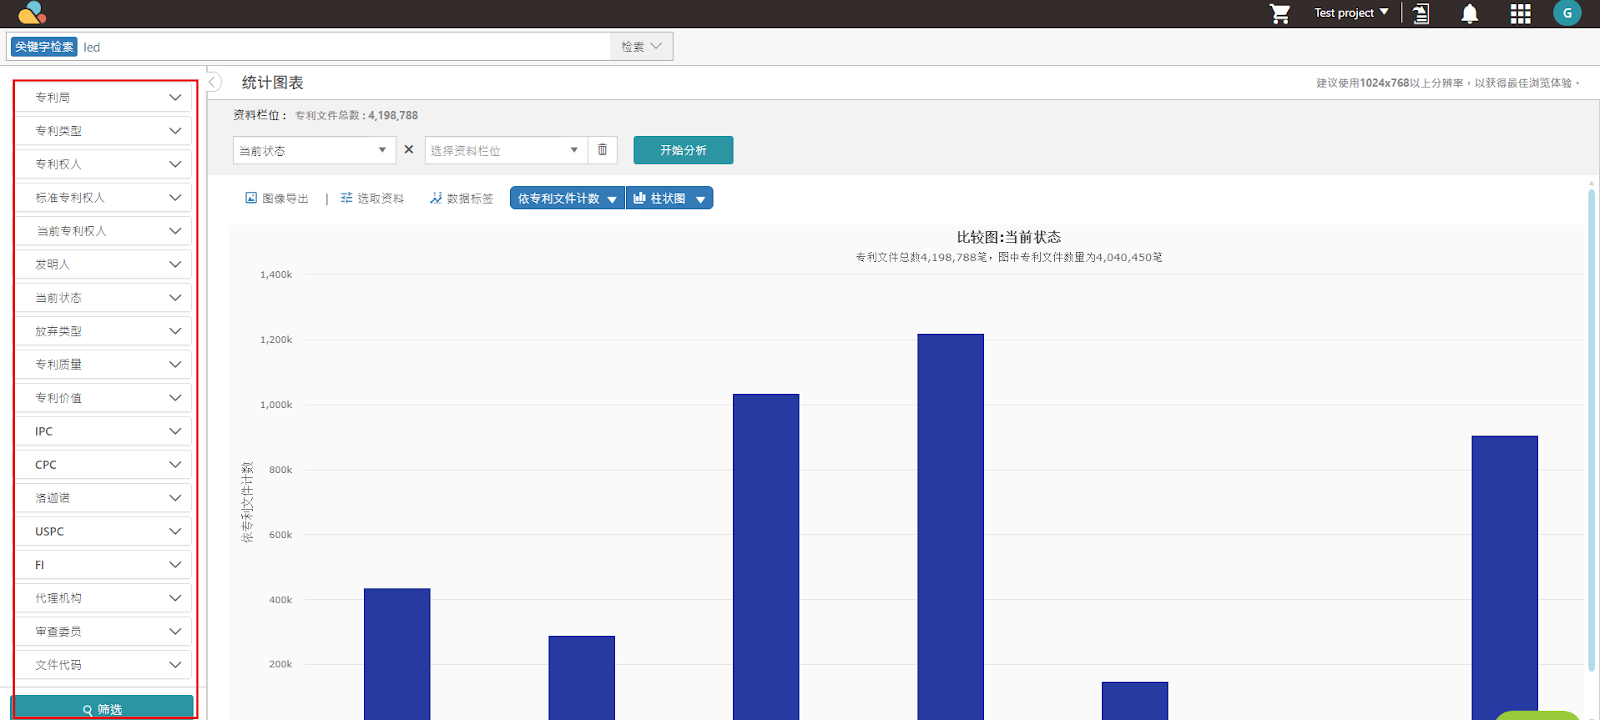
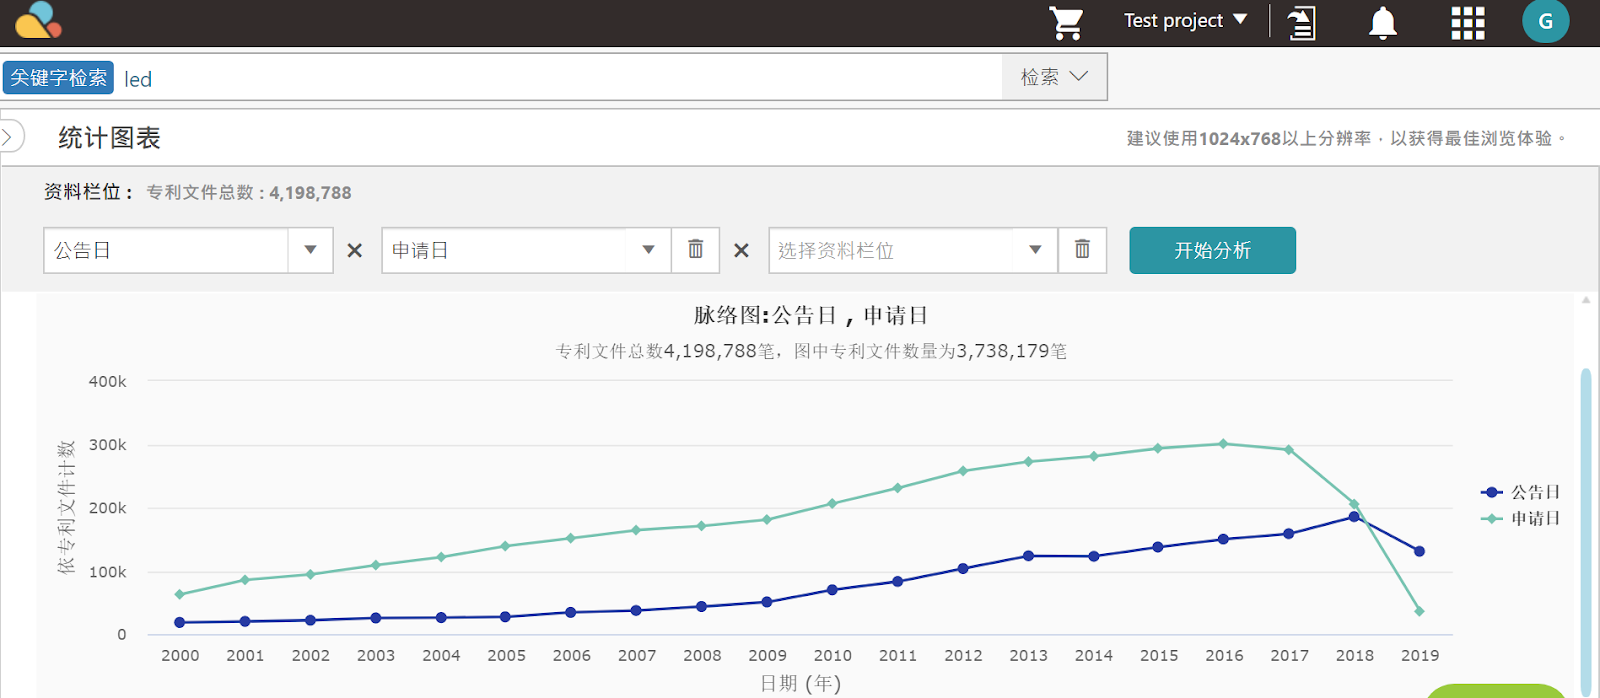
- 选取资料后,「统计图表」会显示如下图;以下例子中包含两个资料栏。
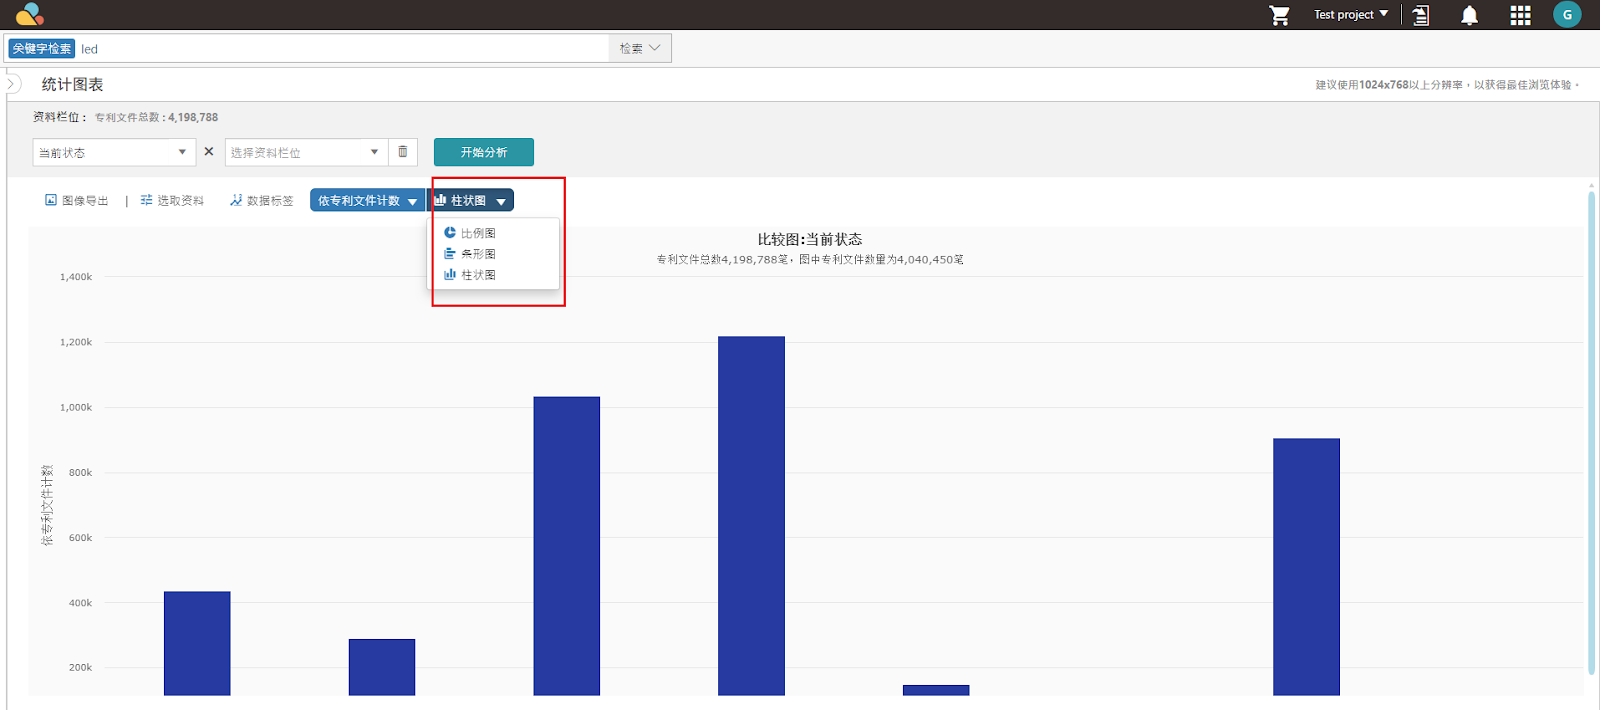
- 您也可用其他形式做统计图表 (例如「柱状图」等),但这些统计图表无法使用在以时间为数据的资料。点选「柱状图」的标誌,您亦可以选取其他相关图表。
- 利用左侧筛选选单得出更精准的结果,请点选您欲使用的参数,再按「筛选」即可。若您找不到筛选选单,按左上方箭头,选单即会显现。