Quality and Value
Gain a macro view of the portfolio’s quality and value, and benchmark against the top patent owners in the technical field.
Summary
See how many active and pending patents are in the portfolio and the percentage of high-value patents. Quickly find the top technical field with high-value patents.![]()

High-Value Patent Families (WIPO, US, CN, EP, JP, KR, TW patents only.)
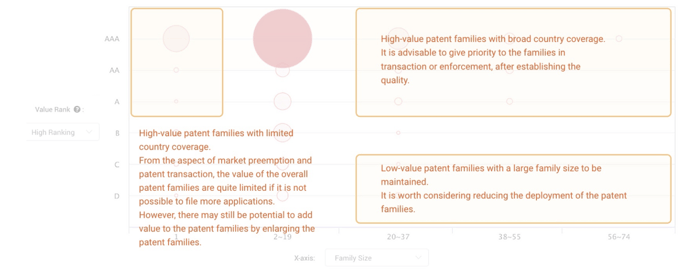
This chart assesses the proportion of high-value and high-regional coverage patent families in the portfolio. Similarly, it can also reflect the proportion of low-value patent families or patent families with limited regional coverage.


- Change the Y-axis setting to view the Patent Value Rankings by the highest-ranking or the lowest-ranking.
- Change the X-axis setting to view the Patent Value Rankings either by family size (number of applications) or family coverage (number of countries covered).
- Hover on a circle to view its family size or coverage and the number of patent families. Click on a circle to view the detailed patent list.
Quality of High-Value Patents (WIPO, US, CN, EP, JP, KR, TW patents only.)
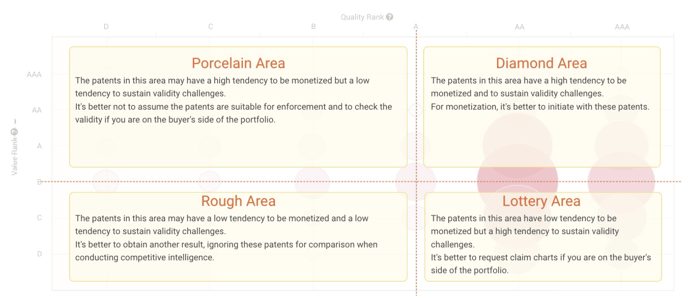
The chart provides a cross-comparison of Patent Quality Rankings and Patent Value Rankings. A patent with high value and high quality may imply that the patent has a higher tendency towards being practiced and will be hard to invalidate.

Peer Comparison in the Same Field (WIPO, US, CN, EP, JP, KR, TW patents only.)
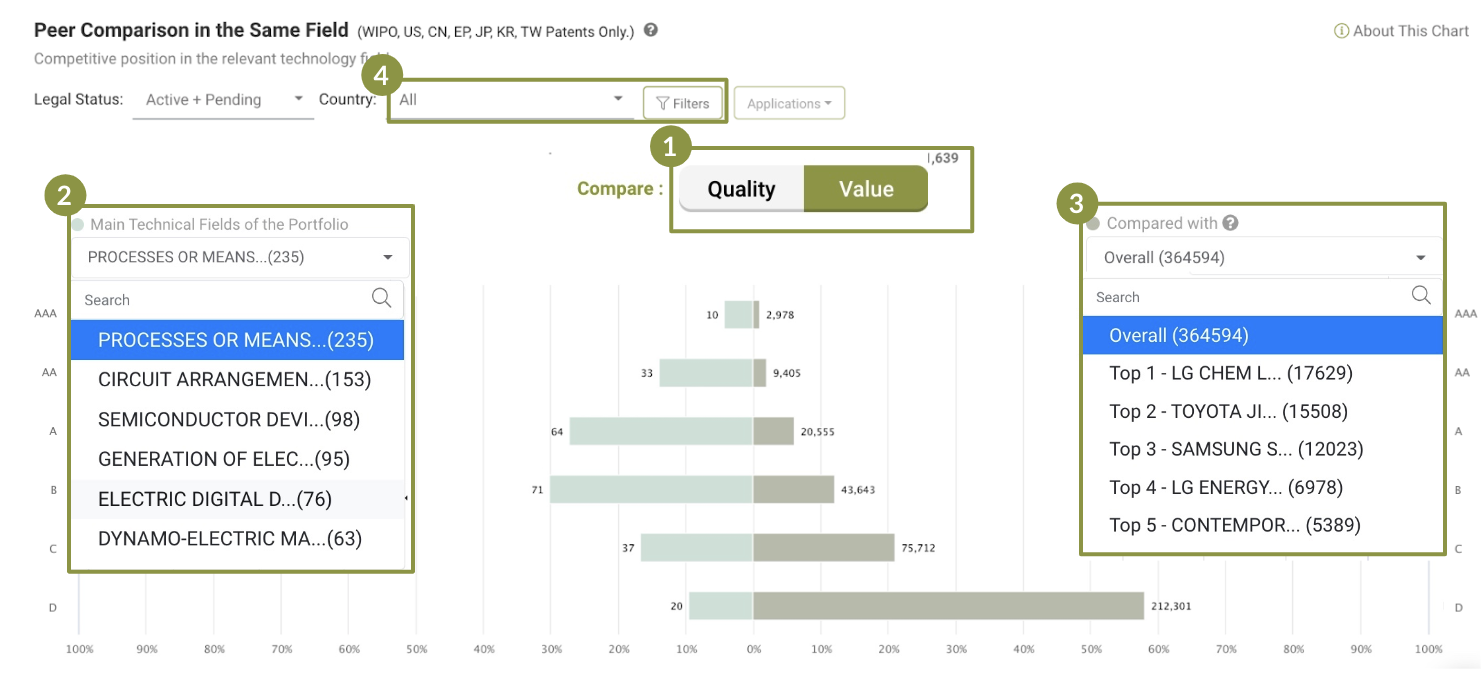
Use Patent Quality and Value Rankings to compare the technology fields in the portfolio with those of the top owners’ portfolios.

- Click to switch to compare either the quality or value.
- Use the dropdown menu on the left to choose from the top technical fields of the portfolio for peer comparison. Peer comparisons can only be conducted under the same technical field (IPC subclass).
- Use the dropdown menu on the right to select who to compare the portfolio to — the overall market or one of the top patent owners in the field.
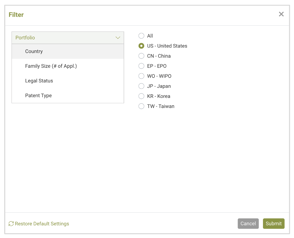
- Use the Country filter to choose whether to conduct peer comparison in the global or single markets.
