Query monitoring is available for Patent Search subscribers who also purchased Patent Vault. This feature allows you to automatically monitor and display the results of your monitor query on a predetermined schedule. To use Monitoring, follow the steps below:
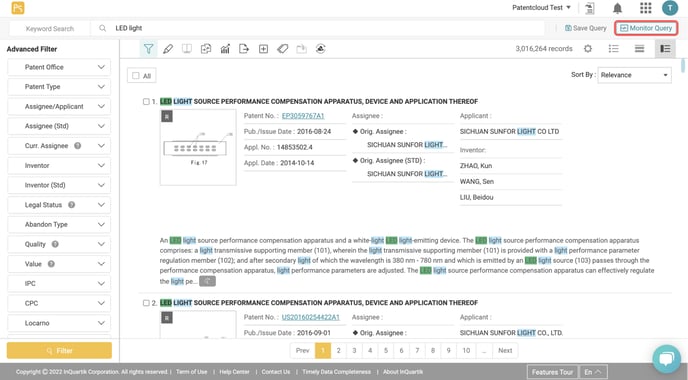
- On Patent Search, enter a query and click on Search.
- On the search results page, click on the Save dropdown button and choose Monitor Query to set up a new monitor.
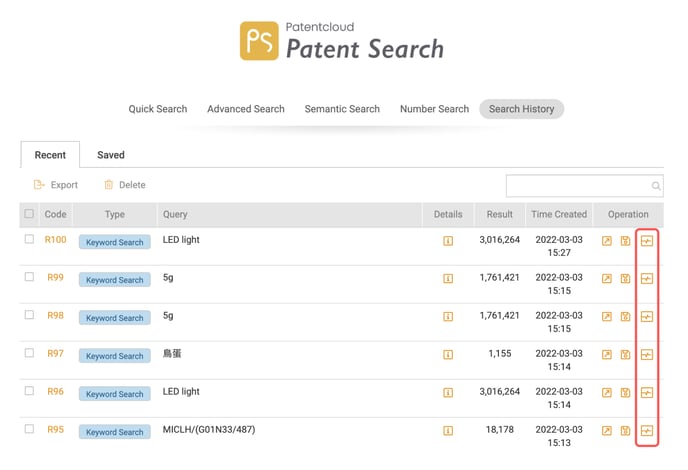
- If you have previously done a search query and want to monitor the same, you can access this in Search History.
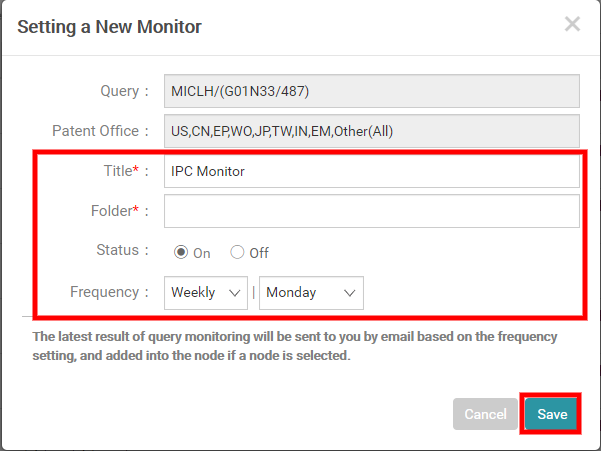
- Once you click on Monitor Query, you can set a Title and save it into an existing folder in your Patent Vault project or create a new folder, and set the notification frequency.
- The ways to view status updates of queries being monitored: go to your project Overview and click on Monitoring Overview under Automatic Monitoring.
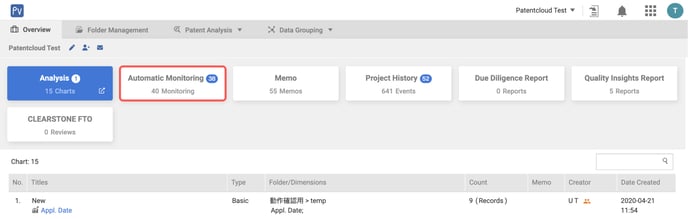
- In the Automatic Monitoring page, you will see your queries here. Once new results are available, the update status bar will change from gray to green. The number of new patents available will be included as well.
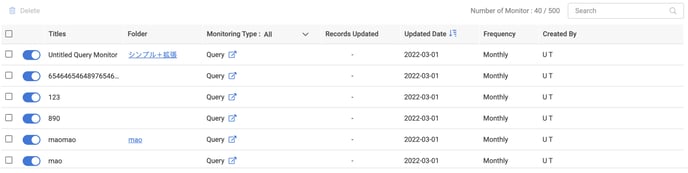
If you add the patents from the search results of the monitoring query to Project, simply click on the folder icon (which is located right next to the update status bar) to access the folder containing the search results.
- Automatic Monitoring feature gives you a more aesthetically pleasing and easy to navigate user interface. Further introductions are below:
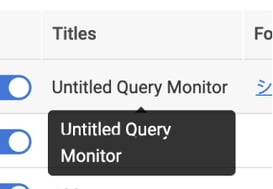
- Quick Search link
Click on the "Keyword Search" link located under the title to perform a brand new search with the same query. Alternatively, just hover the cursor over it to get a reminder of the search parameters.
- Status Toggle
You can start and stop monitoring with a single click: the newly-added status toggle means that you will no longer need to access the edit window
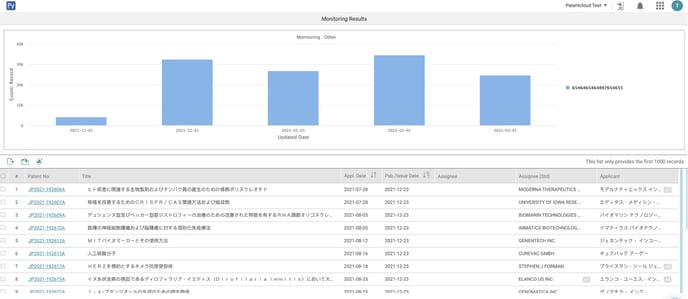
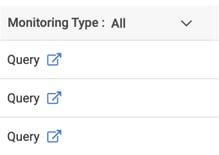
- Monitoring Results Chart
Never miss a new patent again: click on the Monitor Type bar to browse through the update history with the convenient chart and click on any dot to view the details relating to the corresponding date. Additionally, you can add to Project and/or export the data.