Working in Patent Vault
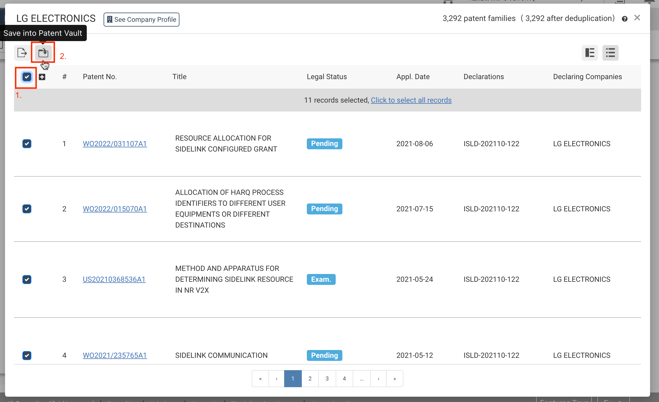
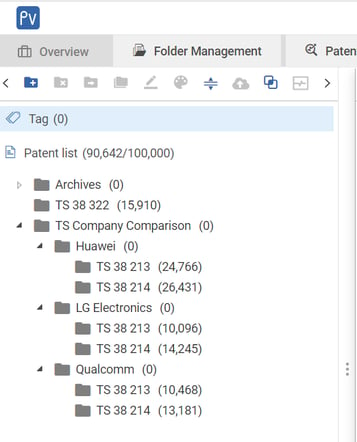
Before working in Patent Vault, you can import the SEP lists you have filtered out in SEP OmniLytics to your desired folders. With your data sorted, you can start your analyses.
Basic Charts
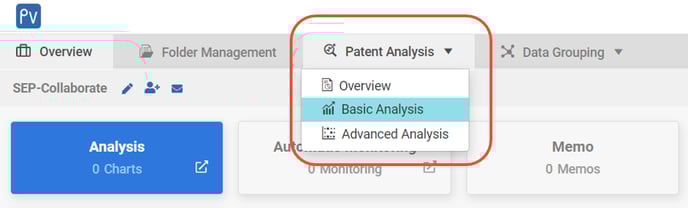
Let’s start with the most basic type of charts using Patent Vault’s Basic Analysis.
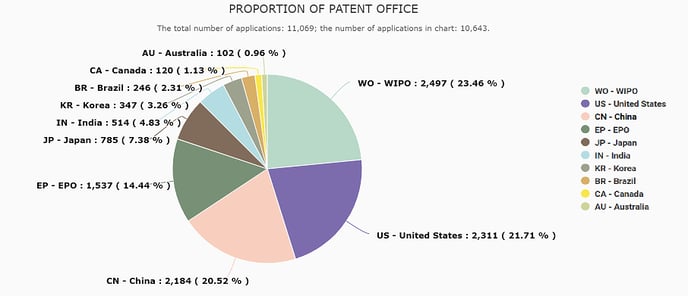
For example, let’s examine the global distribution of SEP applications under the technical specification TS 38 322 (Radio Link Control protocol specification).
For this data set, you can view it as a pie chart, bar chart, or column chart.
Advanced Charts
What’s even better, is that Patent Vault has the capability to produce more complex matrix charts for analyzing and comparing SEP data. Here we will show you just a few examples of what you can do with Patent Vault’s Advanced Analysis function.
Trend Comparison
Let’s say that you would like to compare SEP applications held by different companies under specific technical specifications. At the same time, you also want to see the development trend.
Here we compare the trend for SEPs held by Huawei, LG Electronics, and Qualcomm for two different technical specifications: TS 38 213 “Physical layer procedures for control” and TS 38 214 “Physical layer procedures for data.”
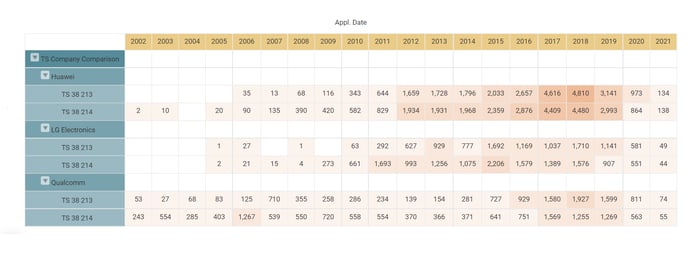
Using the Heat Map option, we can see the focus area for the applications. For the two technical specifications we examine here, we can see that Qualcomm had already started developing technology in these two areas earlier than Huawei and LG, starting in 2002. However, we can also see that the other two companies started to apply for more related patents in 2012 and 2013. By 2017, the number of applications made each year by Huawei had greatly surpassed those of Qualcomm.
Status Comparison
We can analyze the same data set from another viewpoint — the legal statuses of the SEPs under the same two technical specifications.
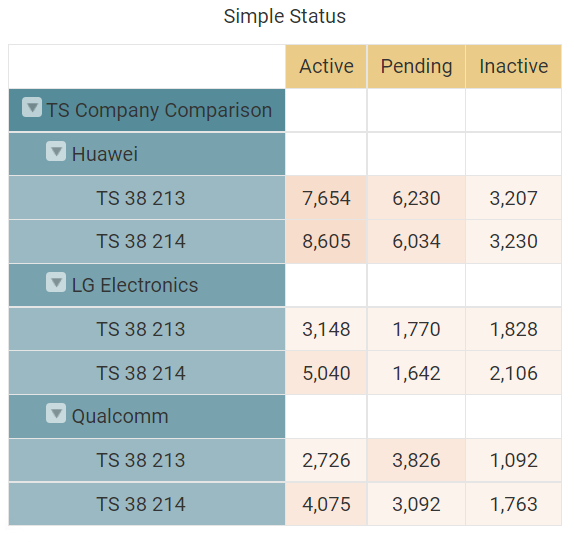
We can tell from this chart that Huawei has a more or less equal amount of active patents under both technical specifications. For LG, it seems that it placed more emphasis on TS 38 214 with the larger total of applications and those granted and active.
Bonus Insights
Patentcloud’s Patent Quality and Value Rankings is an exclusive feature that can be used to find more in-depth insights into patent data. Quality rankings can evaluate how likely a patent can be invalidated and Value rankings assess the chances of monetizing a patent.
Below is an example of the distribution of the SEPs held by Huawei, LG Electronics, and Qualcomm by Patent Value.
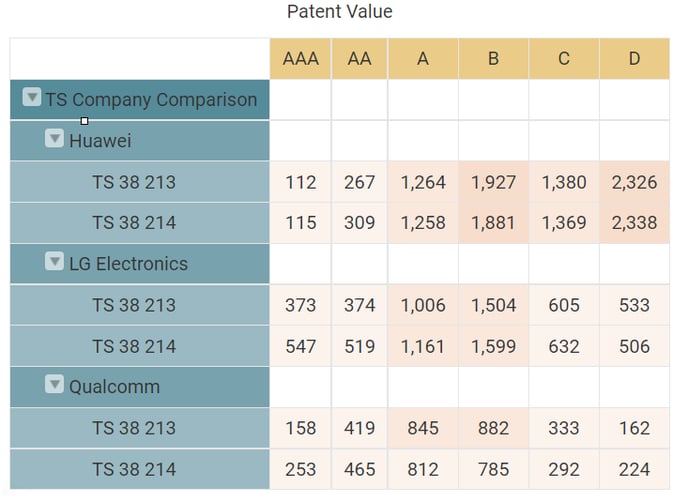
We can see that although Huawei has many more SEP families in total, it has fewer families rated AAA or AA in value than the other two companies.
These are just a few examples of Patent Vault analyses you can do with patent data. If you want to know more, check out our patent analysis article or download our PatentMatrix White Paper for free!
Collaborate with your team
Patent Vault is designed not just for conducting patent analysis, but also to facilitate teamwork and ease redundant tasks such as downloading patent data and setting up various spreadsheets for further analysis.
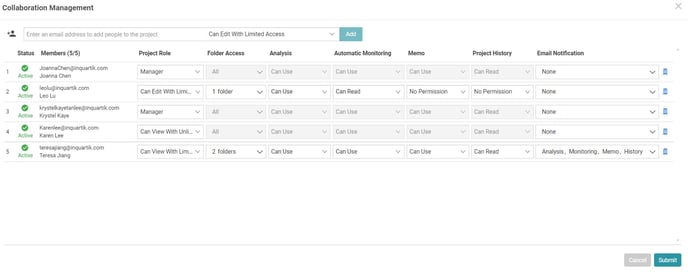
Manage Accessibility
As a project manager, you can manage your team members or anyone collaborating on the project.
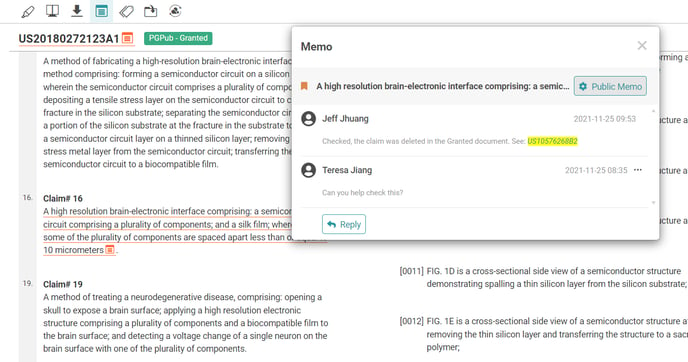
Add a Memo
You can also add Memos as study notes or comments for your team members.
Stay up to date with dynamic patent data
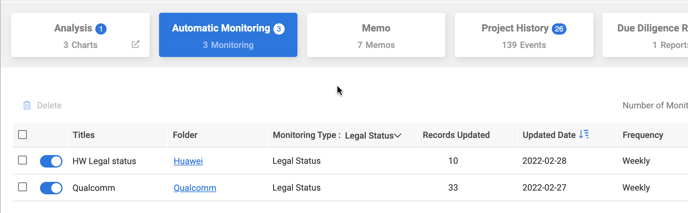
Last but not least, don’t forget to set up the legal status monitor that keeps you updated until the end of your study or project.
For more reading on how Patent Vault — InQuartik’s patent data collaboration tool, check out our Patent Vault article on team collaboration.