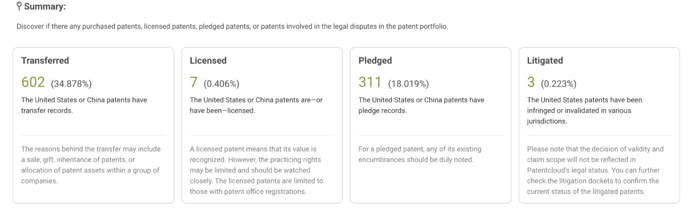
Identify the patents in the portfolio that were purchased, licensed, pledged, or involved in legal disputes.
Summary
Get an overview of the number of patents with historical events at a glance.![]()
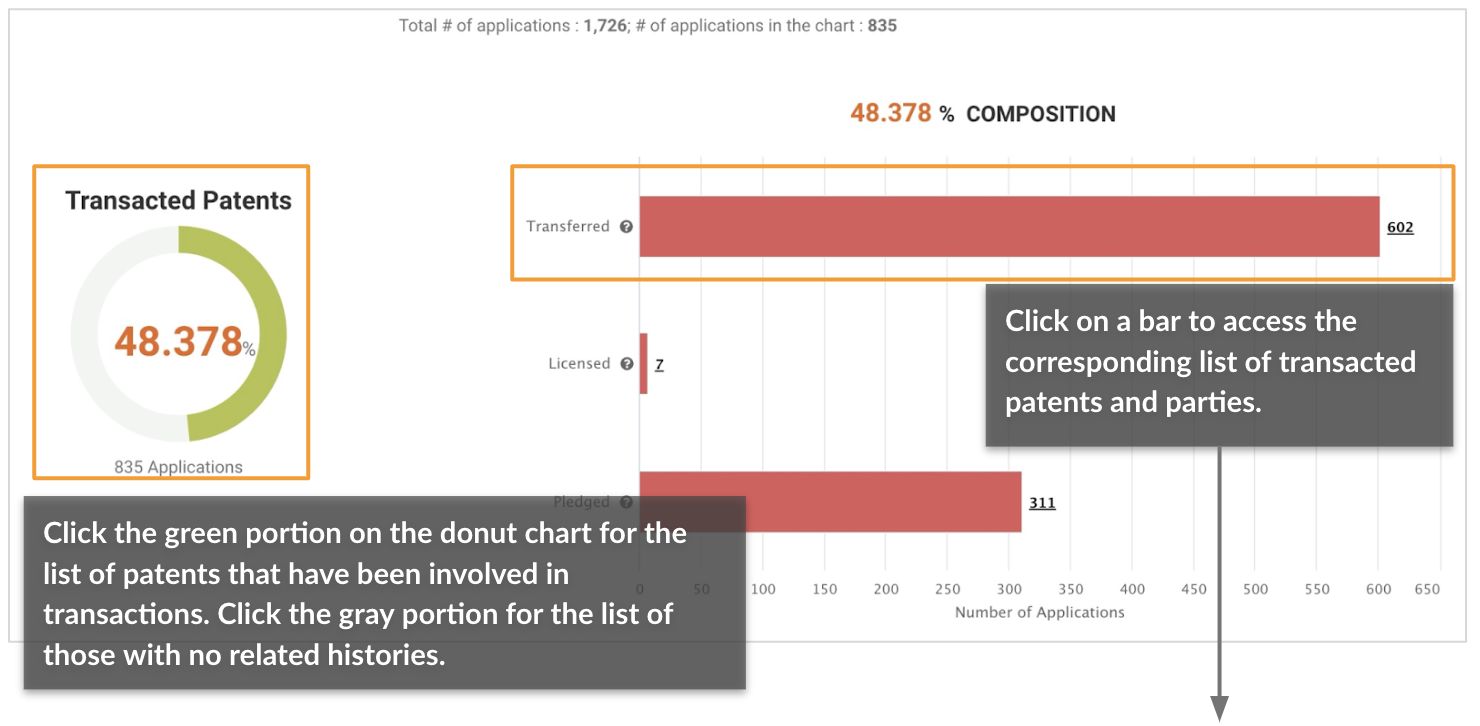
Transacted Patents (US and CN patents only)
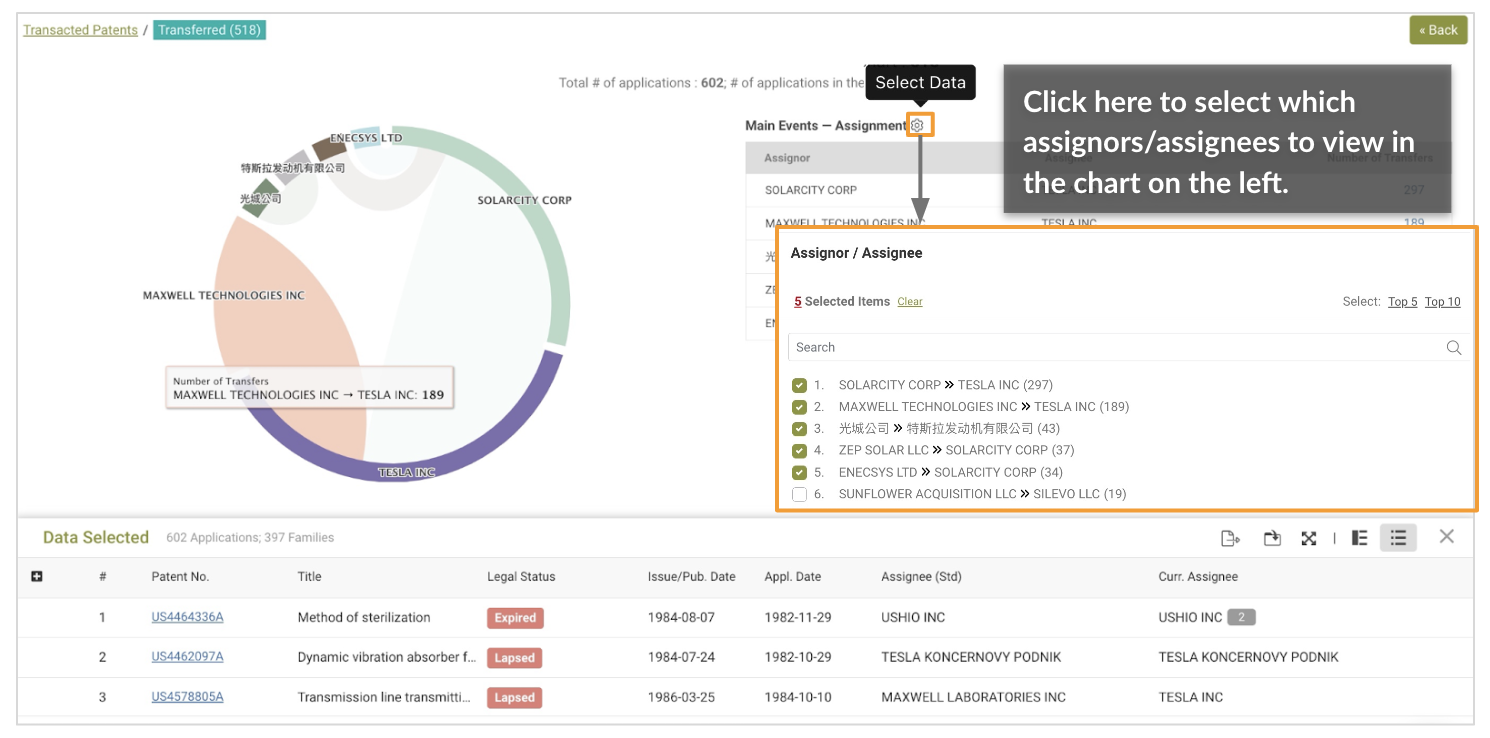
The chart shows the US and CN patents in the portfolio that have been transferred, licensed, or pledged. The data is collected from the assignment database of authority, i.e., the Patent Office.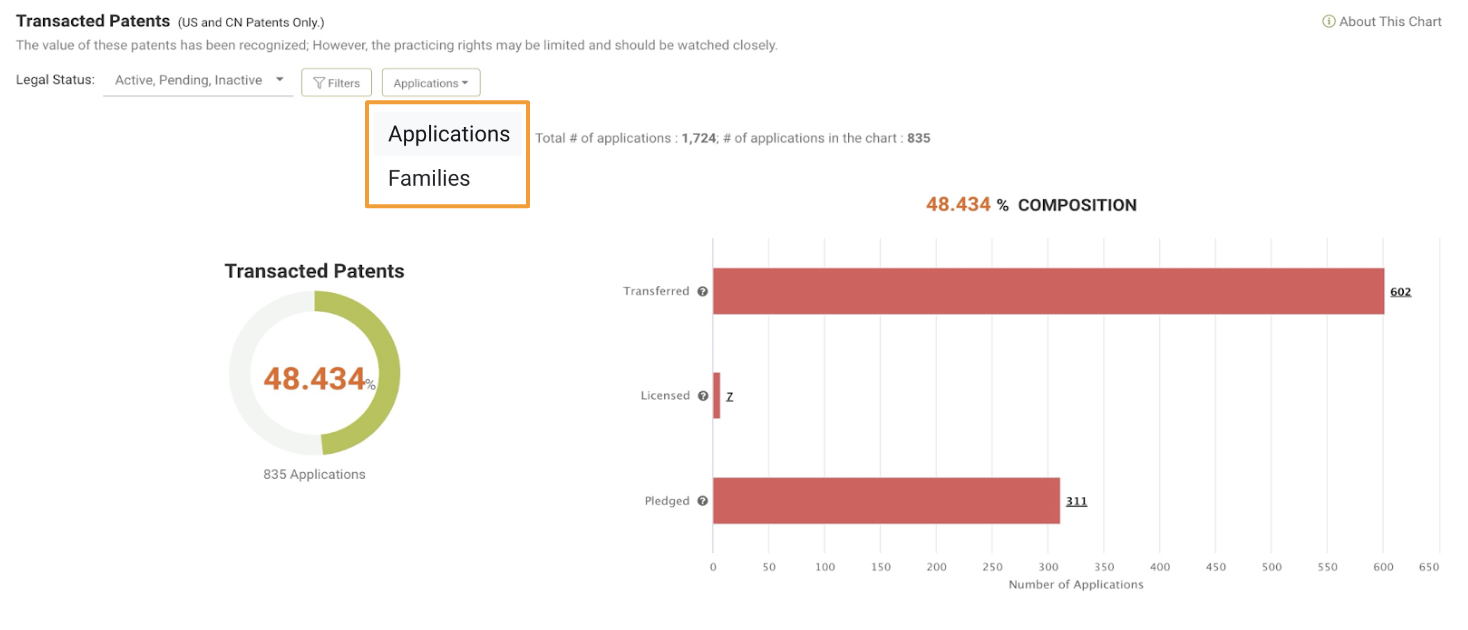
Transactions may imply market recognition of value. However, transactions may also suggest potential limitations in future transactions or enforcement.
The bar chart on the right shows the number of patents that were transferred, licensed, or used as collateral.
A few notes about this chart:
- The assignment records from the inventors to their companies have been excluded from the calculation of transferred patents.
- The licensed patents are limited to those with patent office registrations, which does not cover most licensing deals.
How the numbers are counted and percentage (%) is calculated in the Transacted Patents chart: 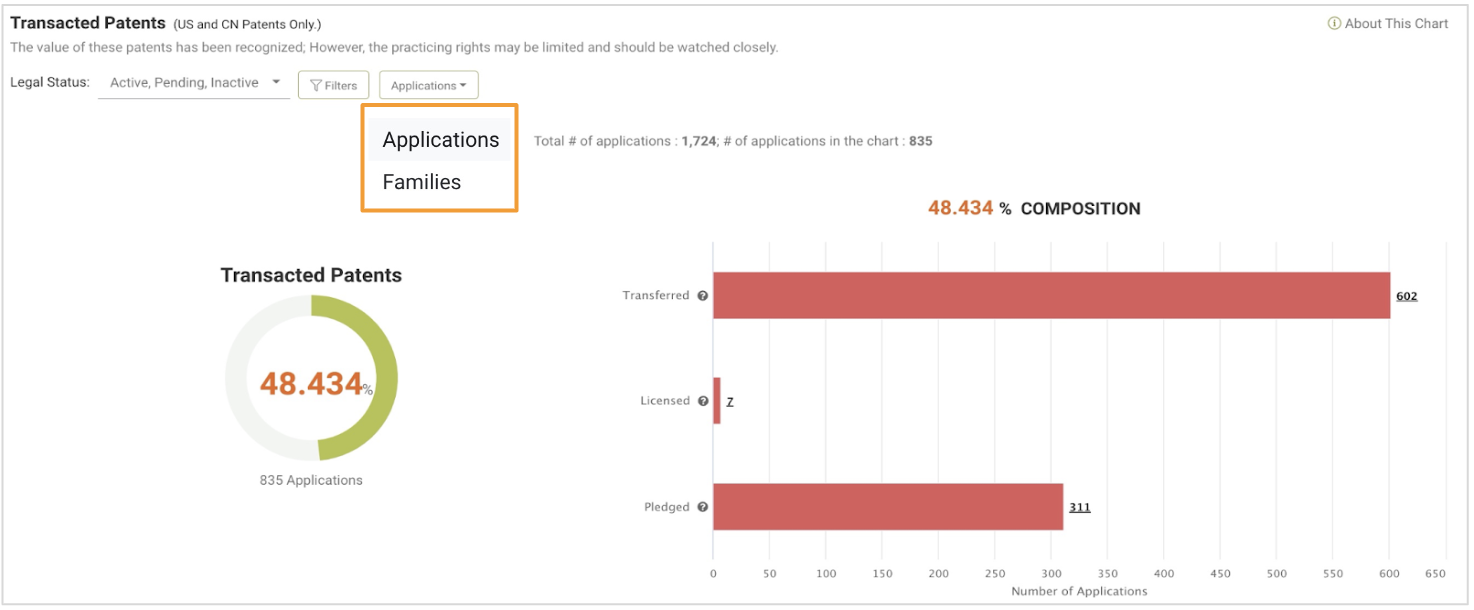
Litigated Patents (US patents only)
The chart provides information on patent families with U.S. patents that have been involved in litigations and the corresponding jurisdiction.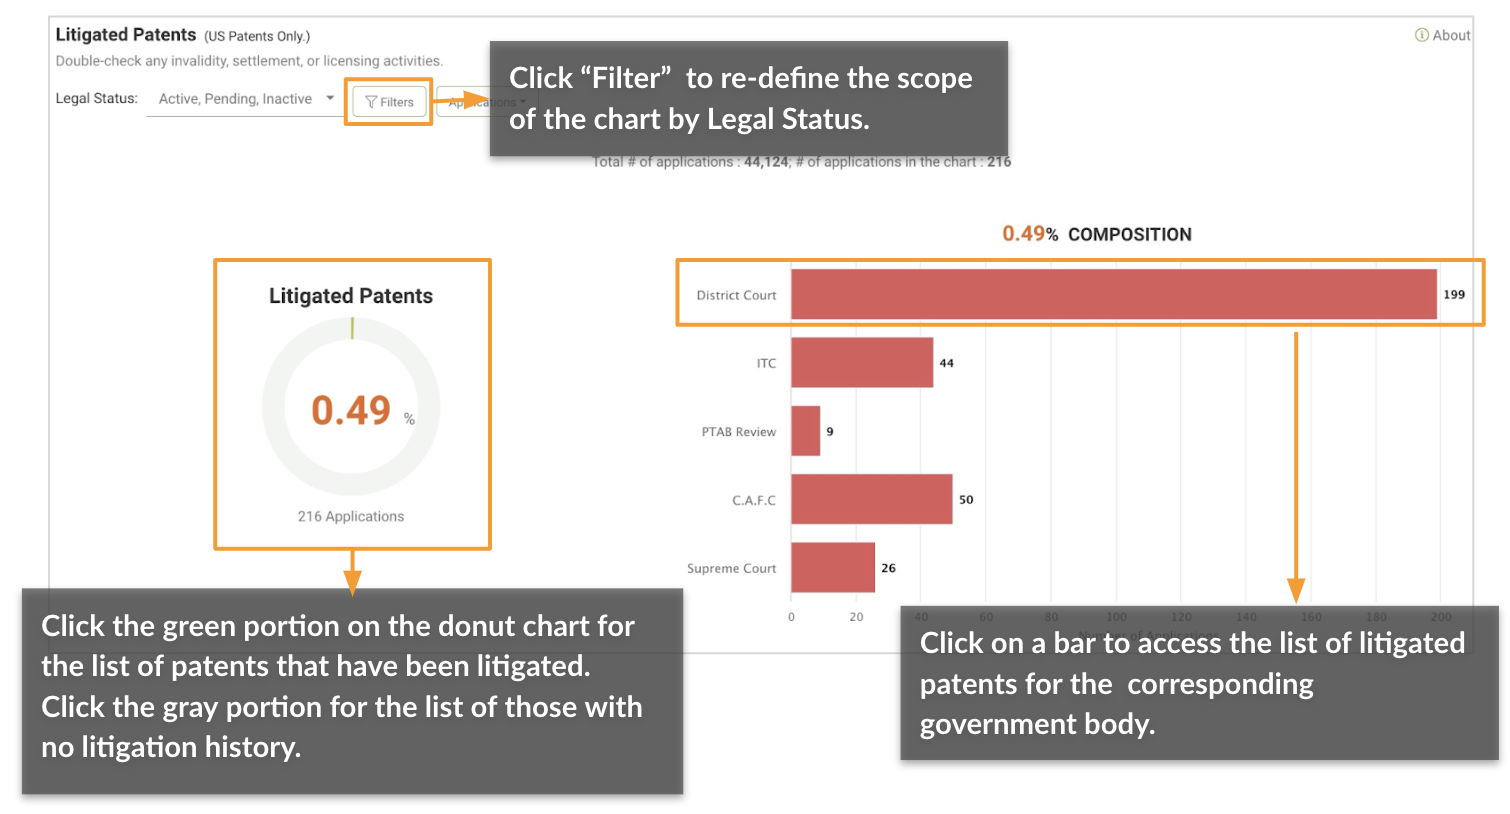
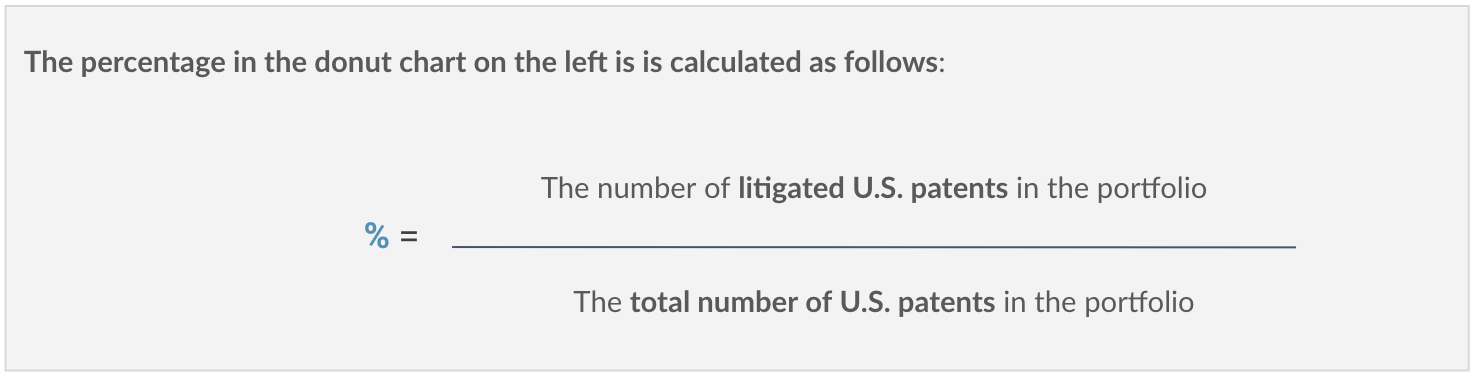
The percentage is calculated similarly for families, except that the “number of U.S. patent families” is used instead.