Data Grouping is a feature that enables the user to consolidate data together for better visualization. A set of assignees, agencies, agents, inventors, or examiners can be treated as one variable based on the user's definition.
Create a Group
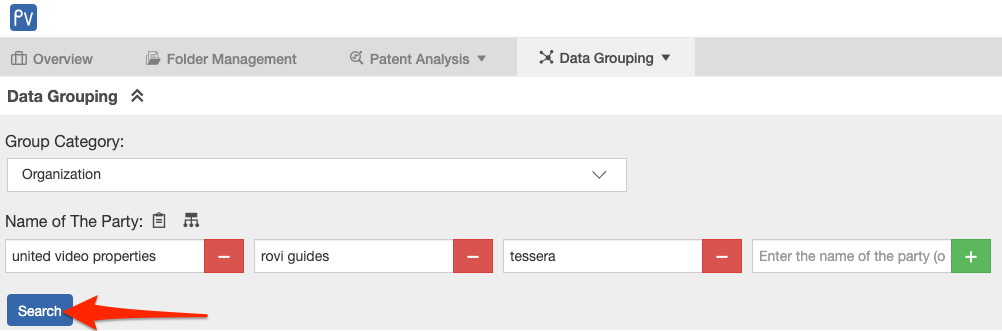
- Go to Data Grouping.
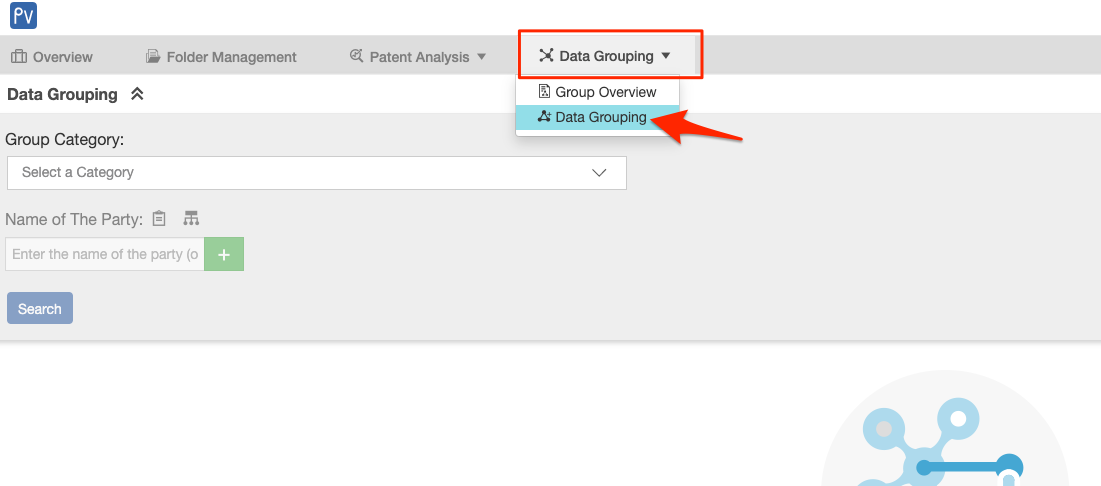
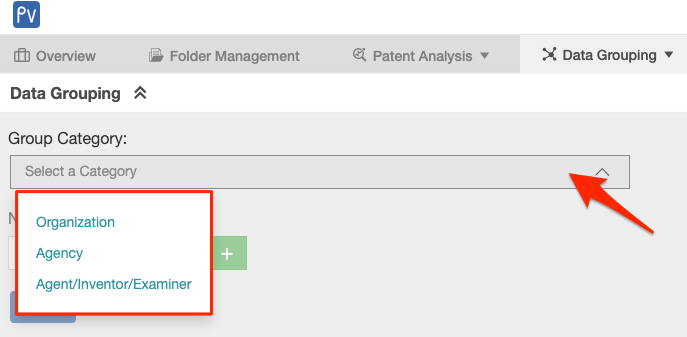
- Select the Group Category from the dropdown to group by Assignee, Agency, or Agent/Inventor/Examiner.
- Enter the name of the party directly into the search box. To view the names within the project, click on the Select a Party icon.
Note: Users can also use the Corporate Affiliation icon to select affiliates.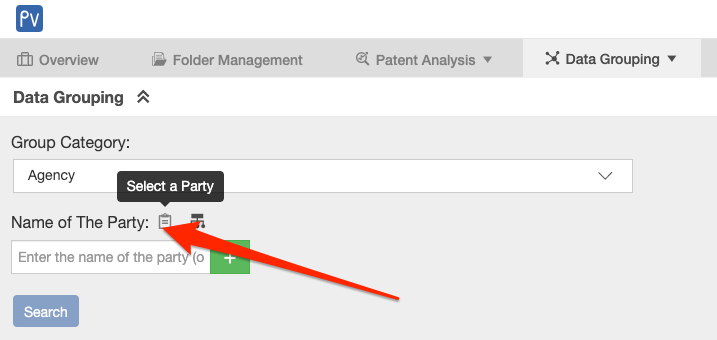
- Use the Filter and tick the checkboxes of the parties to combine in a group. Then, click on Confirm.
Note: Users may select multiple party names across different filter categories.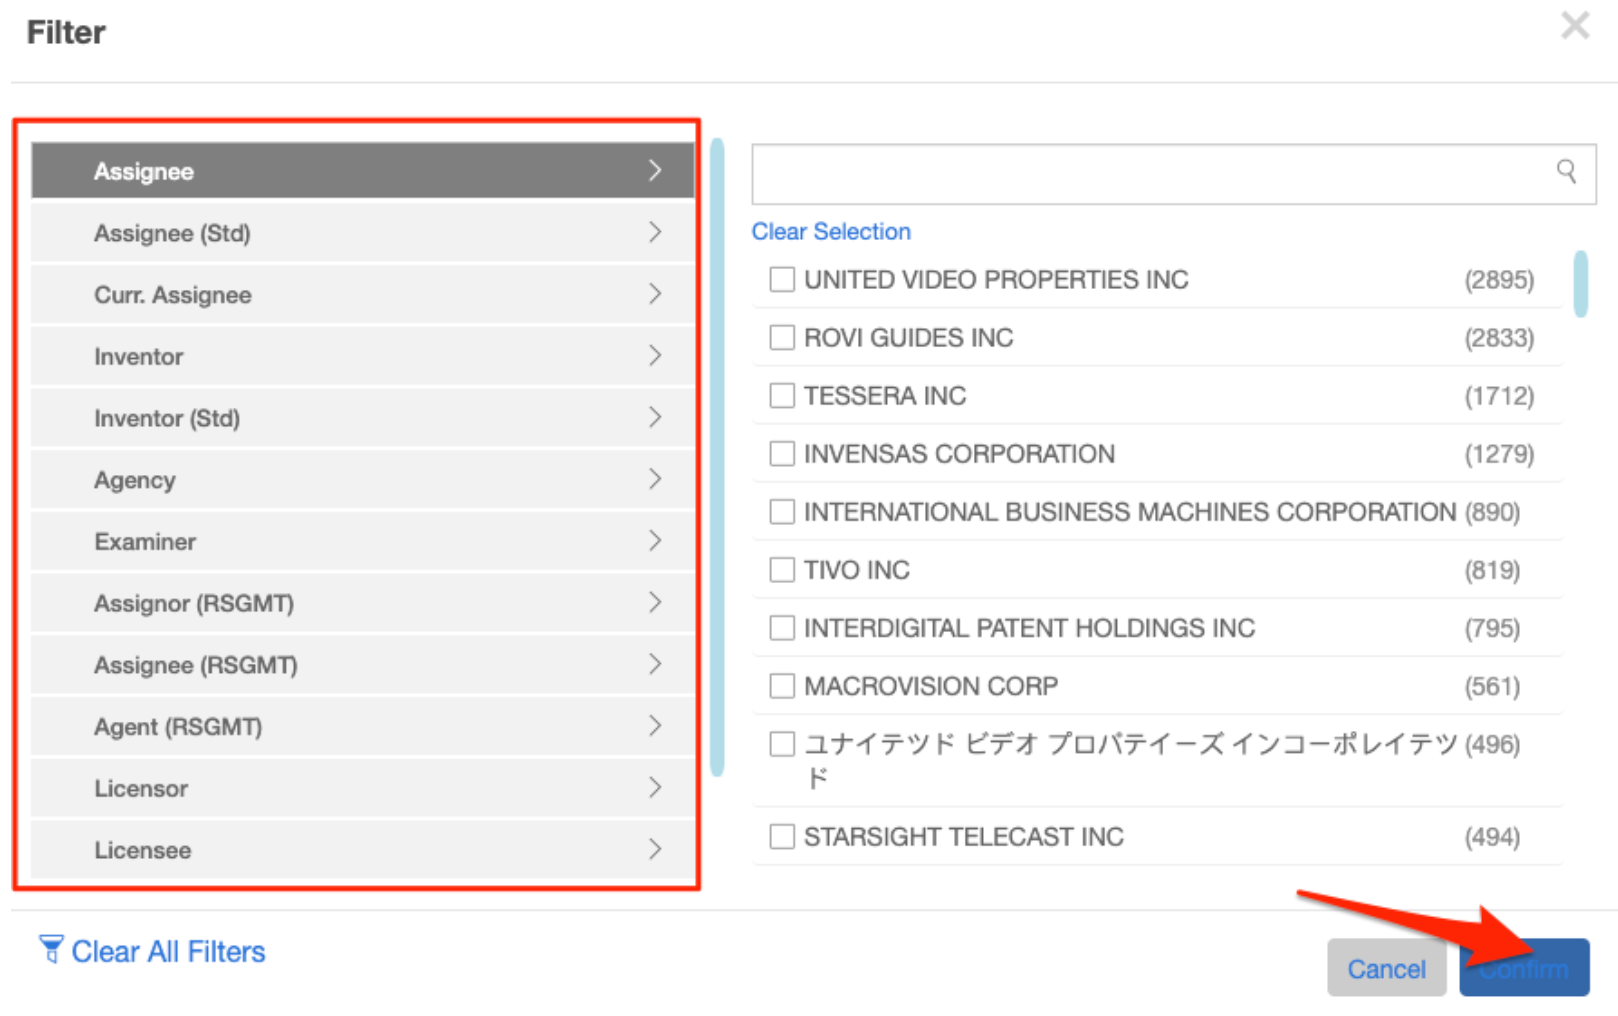
- Once the parties have been selected for combination, click on Search.
- Expanded Search Results will be displayed, which show the number of patents involving the party/ies’ names — selected and based on the category selected in the previous step.
- Review the list and tick the checkboxes for the parties required for grouping together. Then, click Save.
The example below shows the count of patents by organization (pledgee, assignee, and assignor) for the three parties (United Video Properties, Rovi Guides, and Tessera).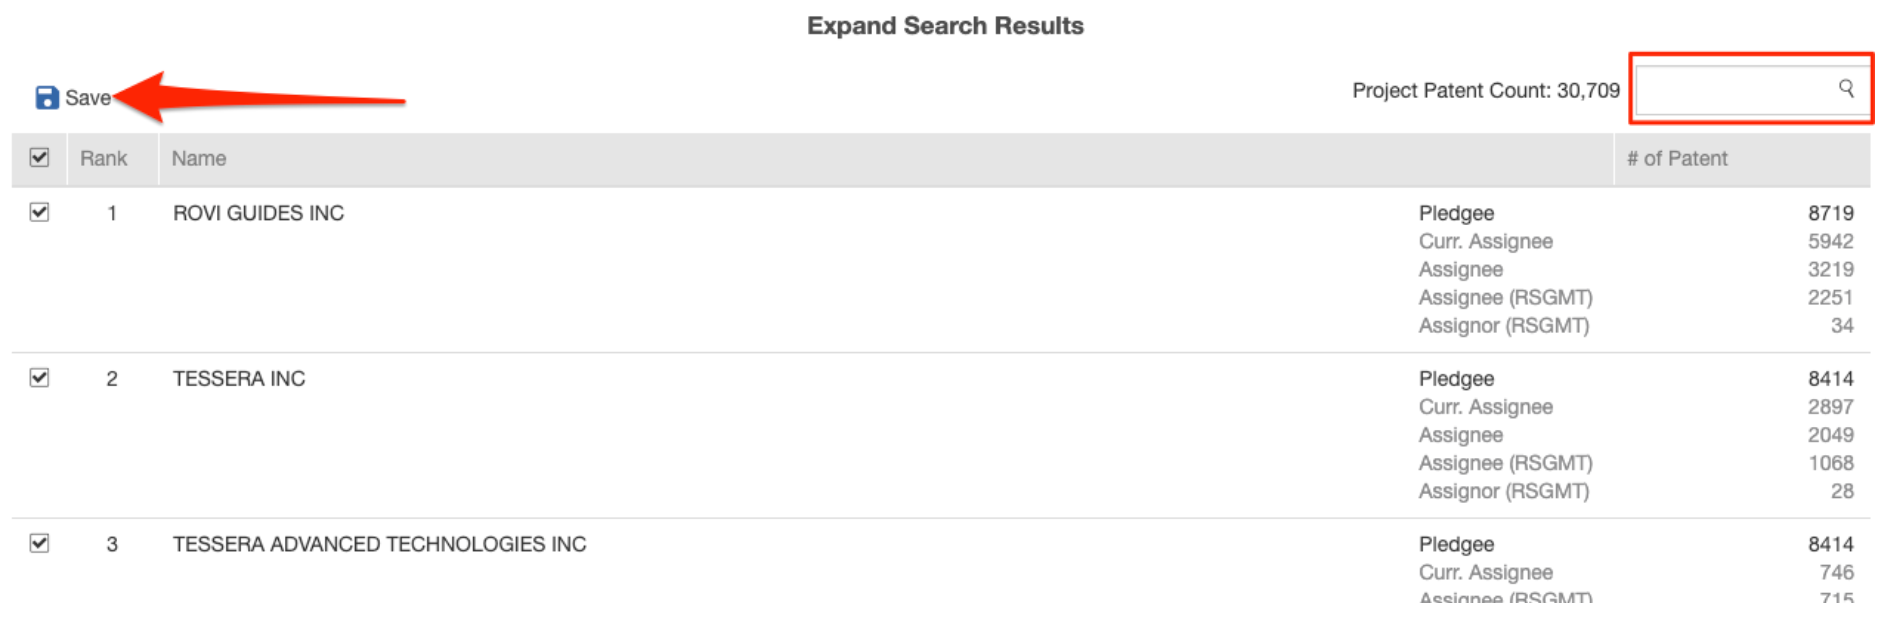
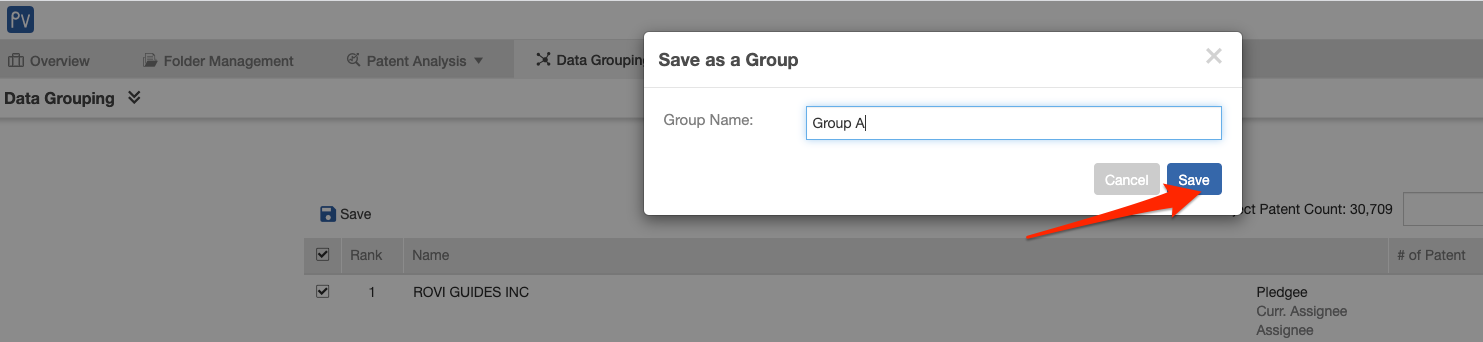
- Create a Group Name and click on Save.
Use Data Grouping in Analysis
Either in Basic or in Advanced Analysis, users can use their saved data groups as individual variables.
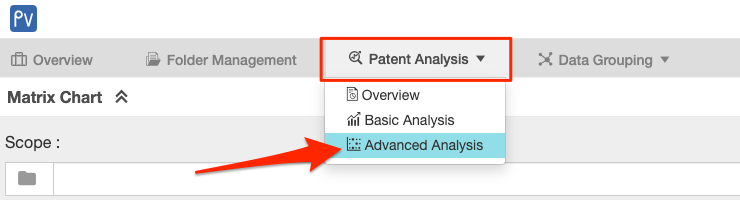
- Go to Patent Analysis and choose either Basic or Advanced.
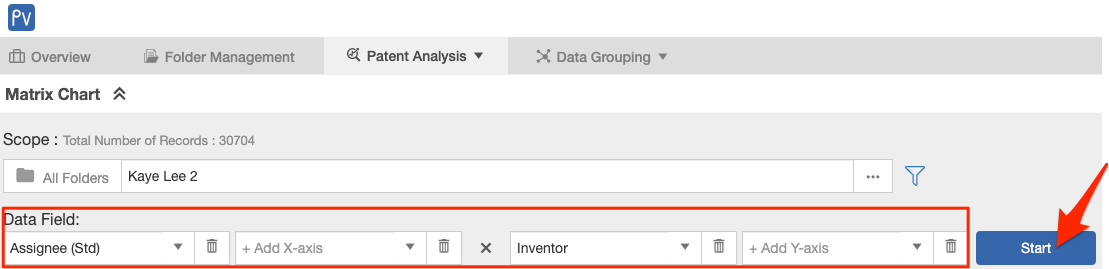
- Set the parameters. Data groups are only available for assignee, agency, agent, inventor, and examiner.
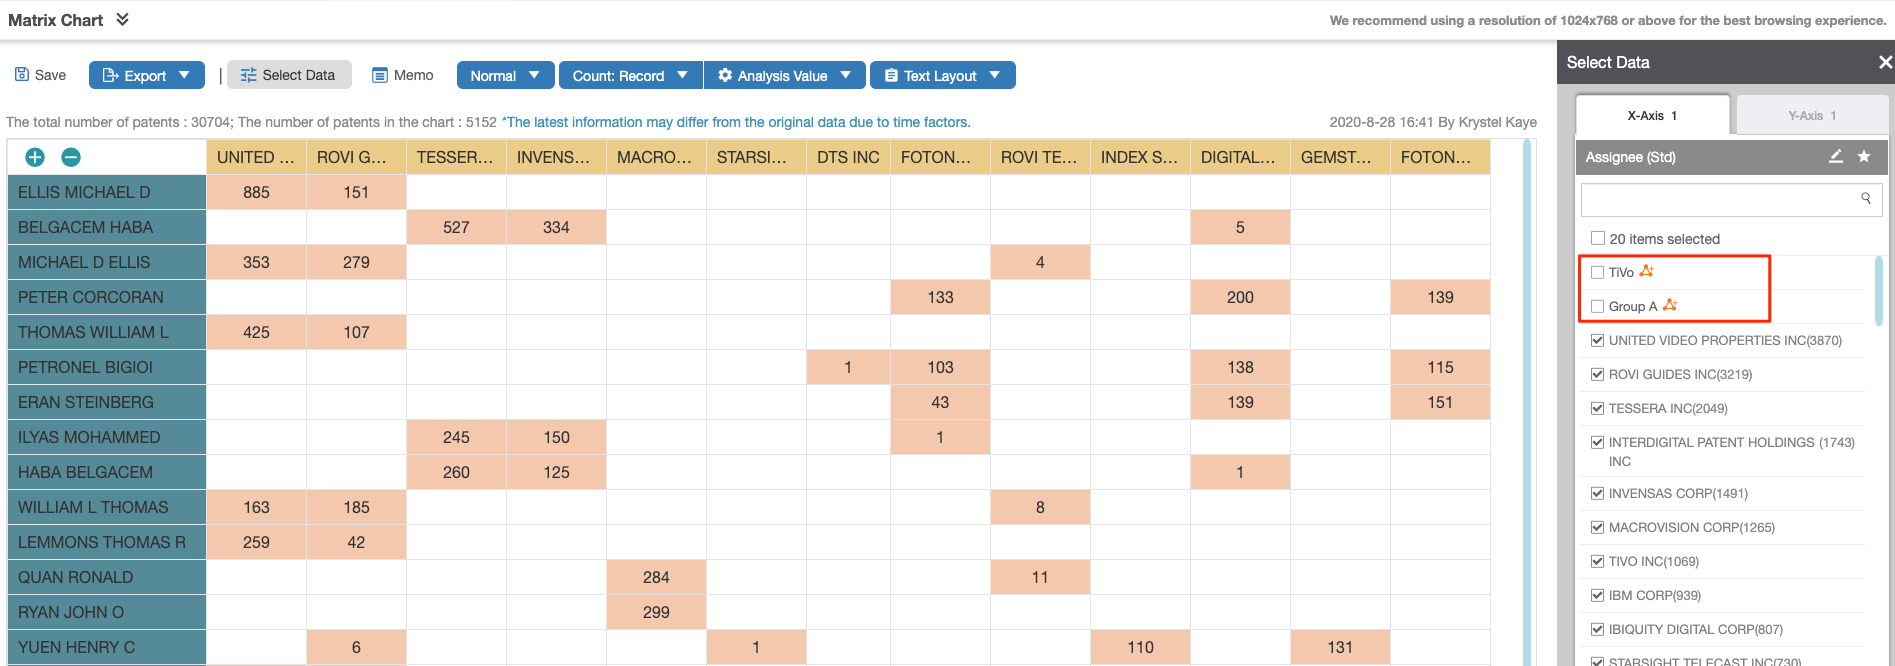
- Click on Select Data to see the created data groups (under Assignee).
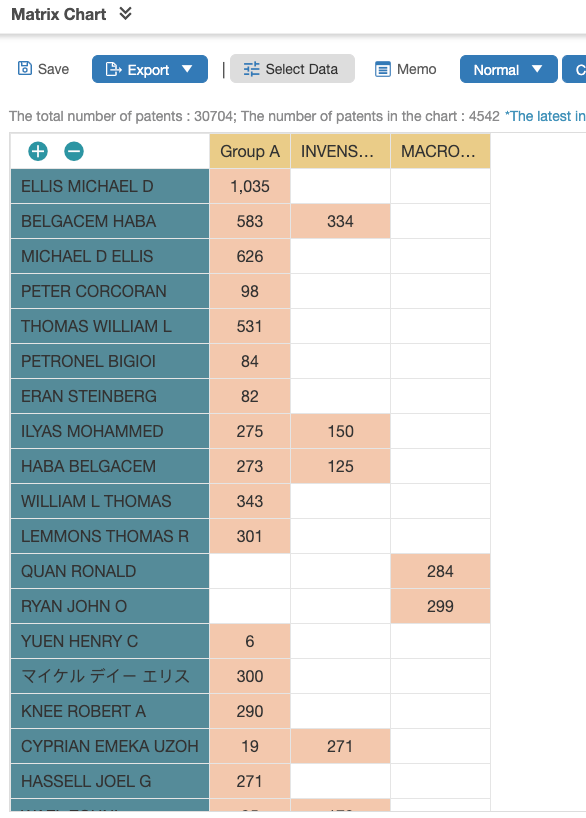
- Select the data group(s) and compare it/them with other party names in the list. Then, click on Generate Chart.
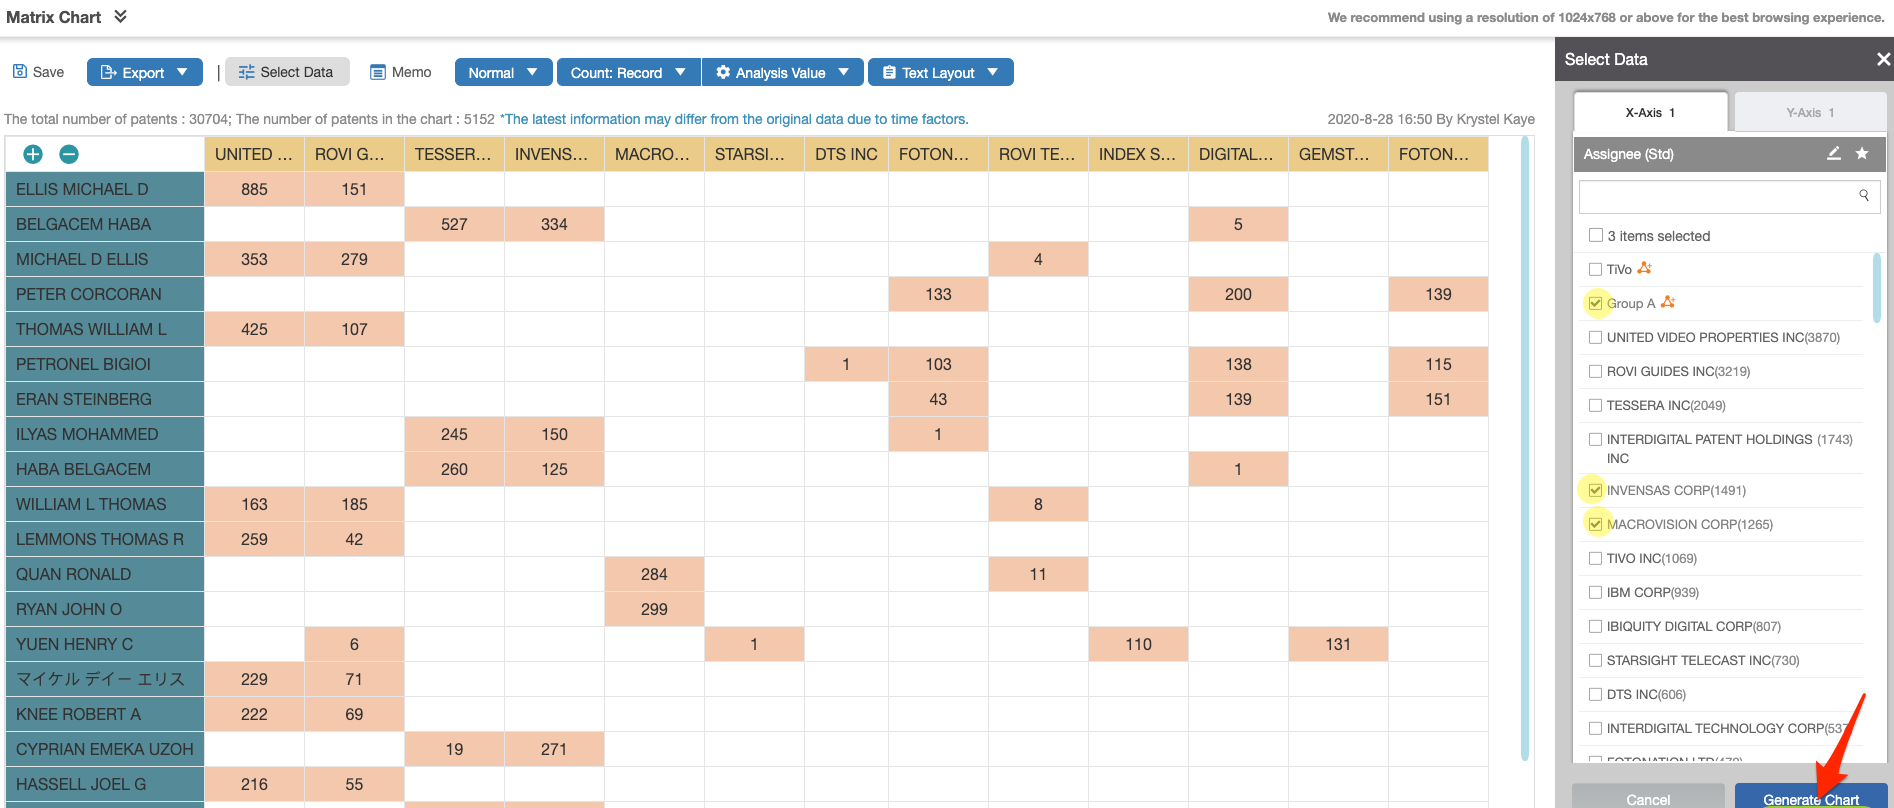
- A new Matrix Chart will be generated based on the selection.