Basic Analysis
Patent Vault offers basic analyses on a folder of patent data. To use this statistics feature, follow the steps below:
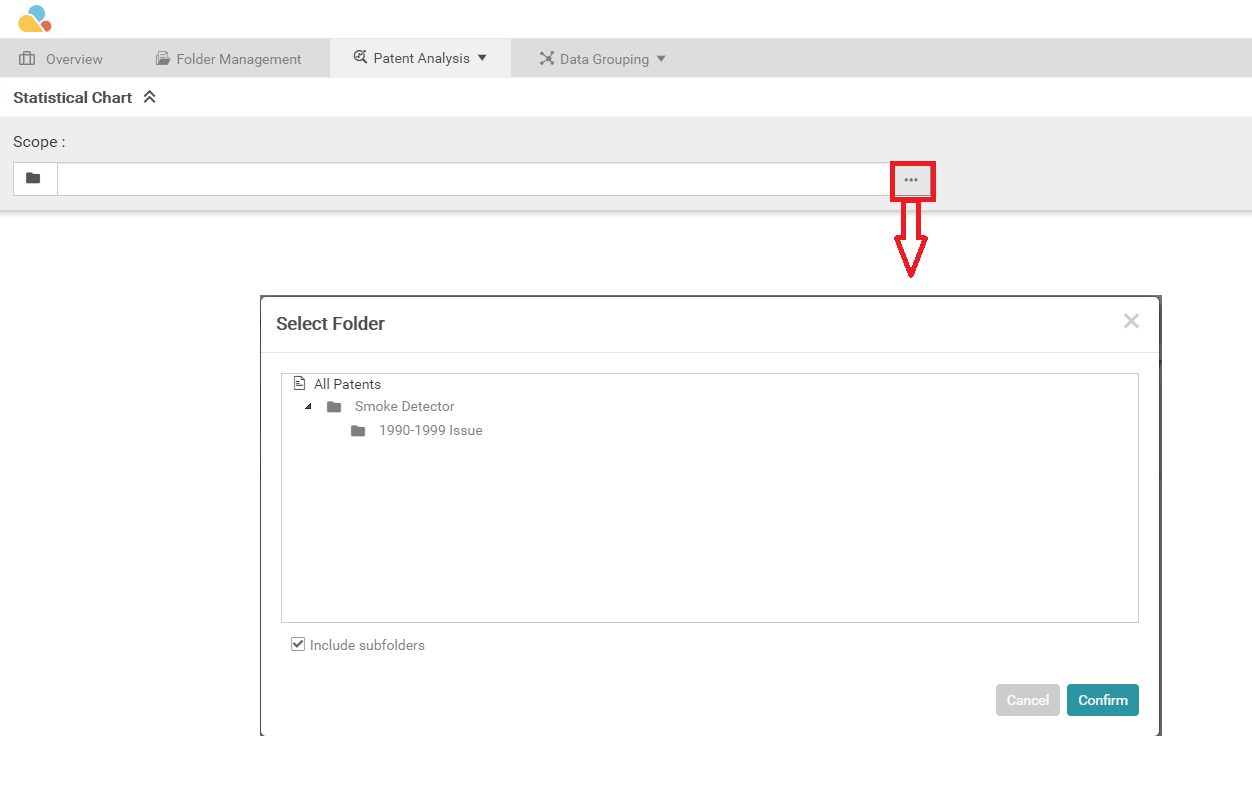
- In Patent Vault, click on Patent Analysis and choose Basic Analysis from the dropdown menu. A new window called Scope will appear.

- In Scope, select the source of the patents to use in the basic analysis, and click on Confirm.

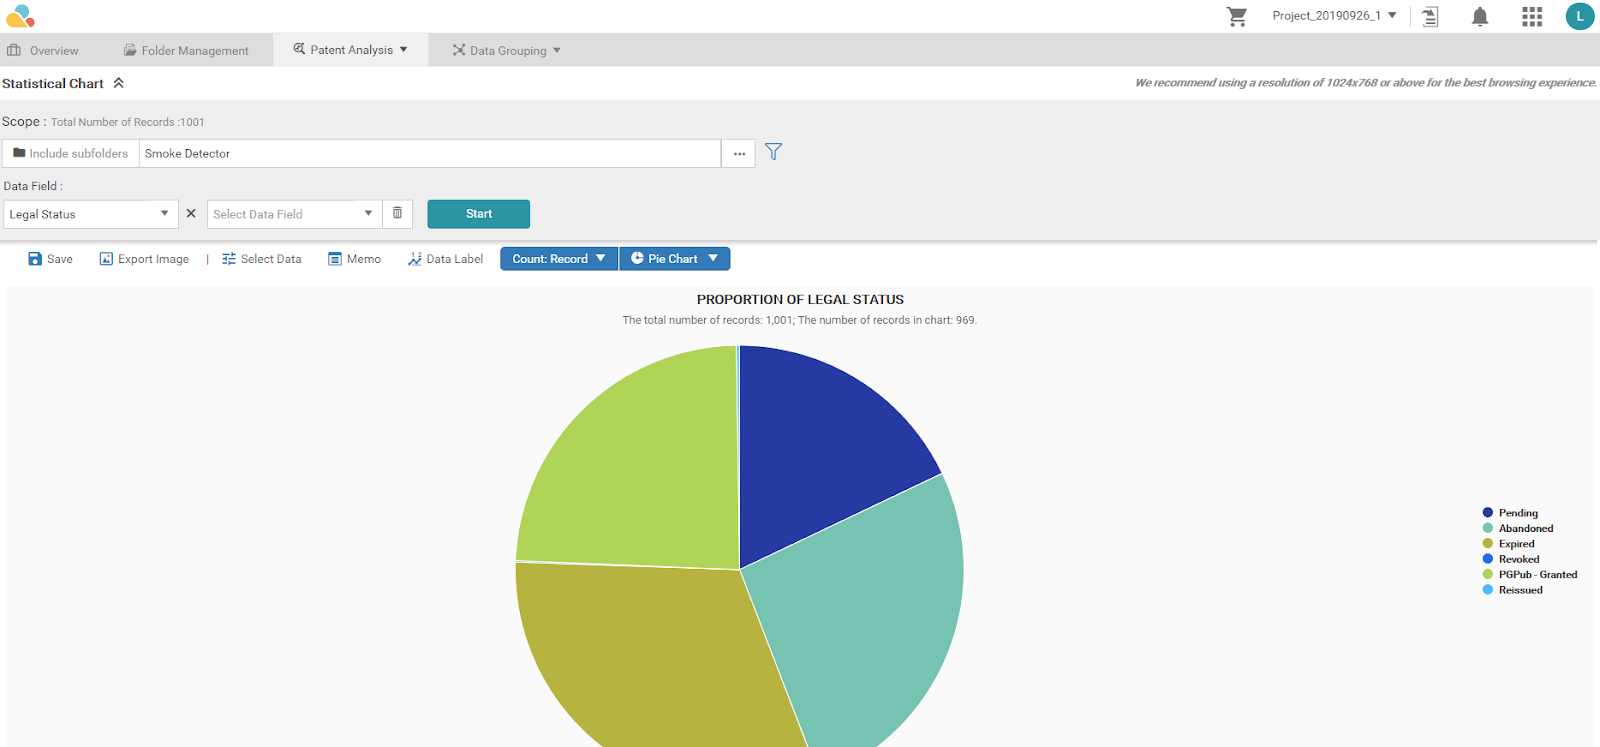
- Select the parameters required for the chart using the Data Field dropdown, then click on Start.

- Click Save to save the chart to the project and then open the saved chart in the Overview page, and click on Analysis Overview.

To share a chart with the members of the project, please follow the steps below:
- Go to Overview, and in the Analysis box, click on Analysis Overview.

- Locate the required chart title for sharing. Hover the mouse on the title to see the icon shortcuts for Edit and Delete.
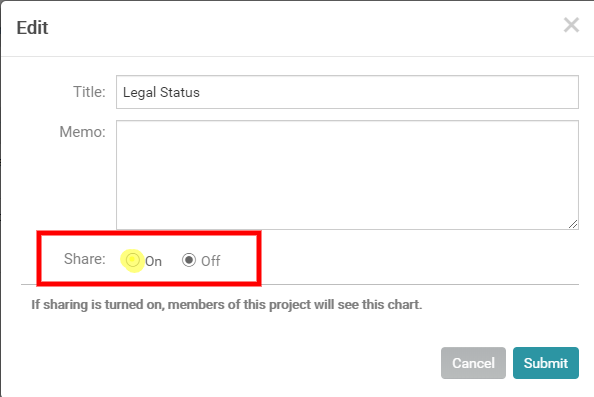
- Click on Edit
 , and in the Share field, click On.
- Go to Overview and refresh the page. This will then be reflected as an additional record in Analysis.
