Contents:
Renaming a Field in the Patent Matrix (Only for Data Fields under Party)
Patent Assignments with the Patent Matrix
Matrix Chart
For a spreadsheet-like analysis of patent trends, users can utilize the Matrix Chart.
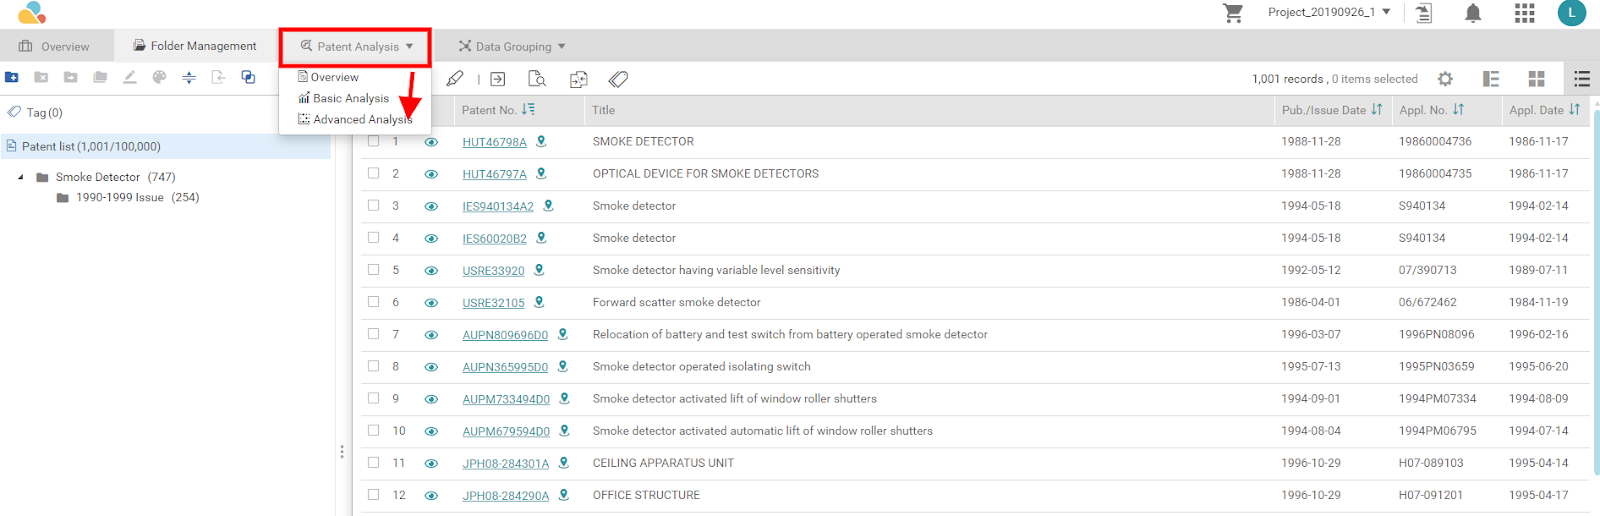
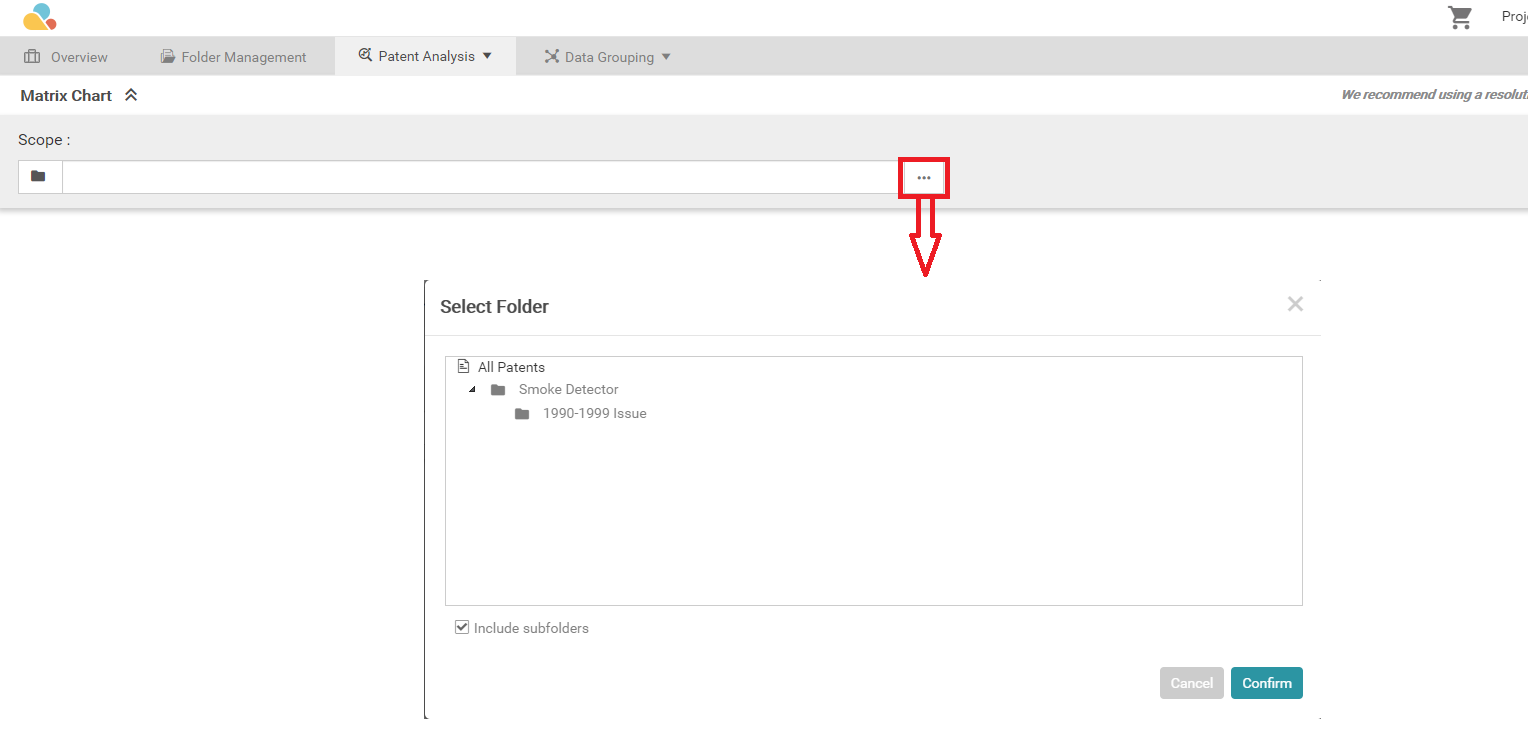
- Click on the Advanced Analysis option from the dropdown menu, and a new window will appear. In Scope, select the source of the patents to use in the advanced analysis, and then click on Confirm.
- For the X-axis and Y-axis, select the desired parameter(s) from the Data Field dropdown. These items will populate in the spreadsheet. Then, click on the Start button.
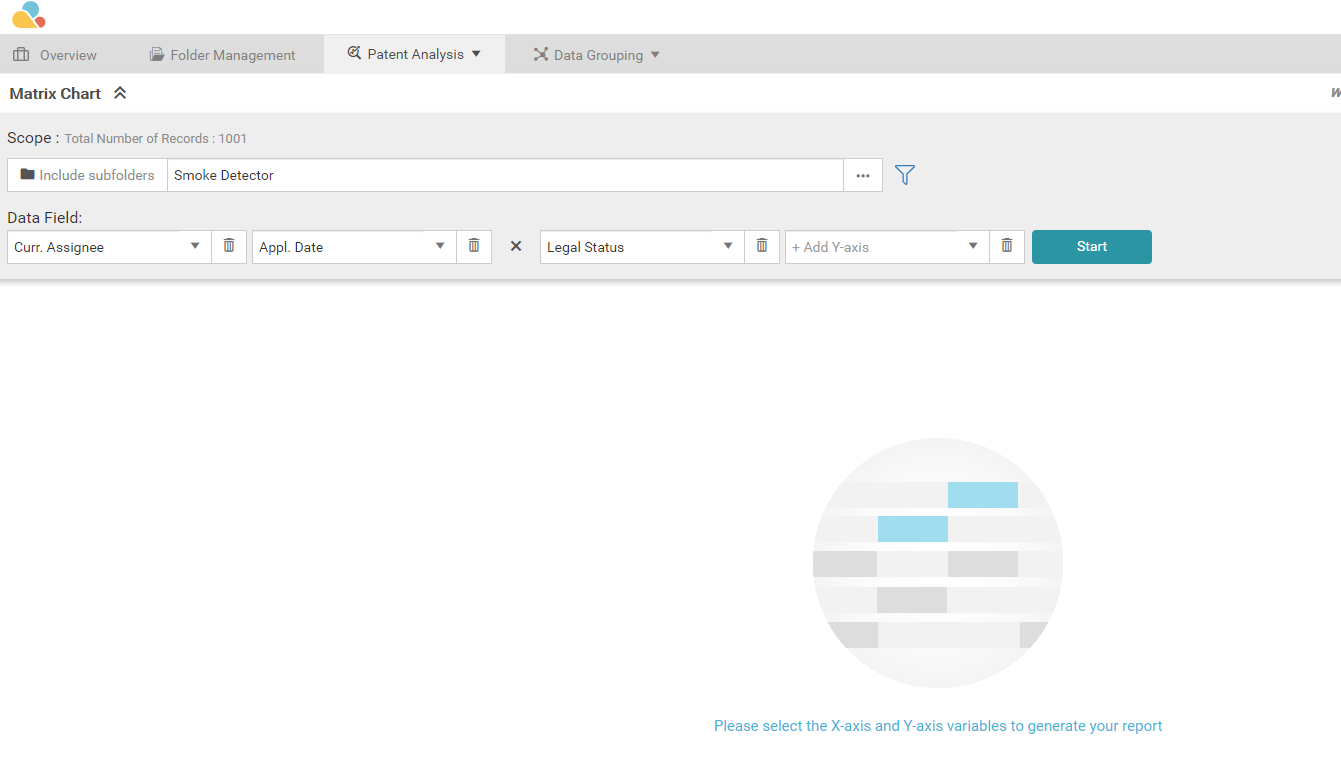
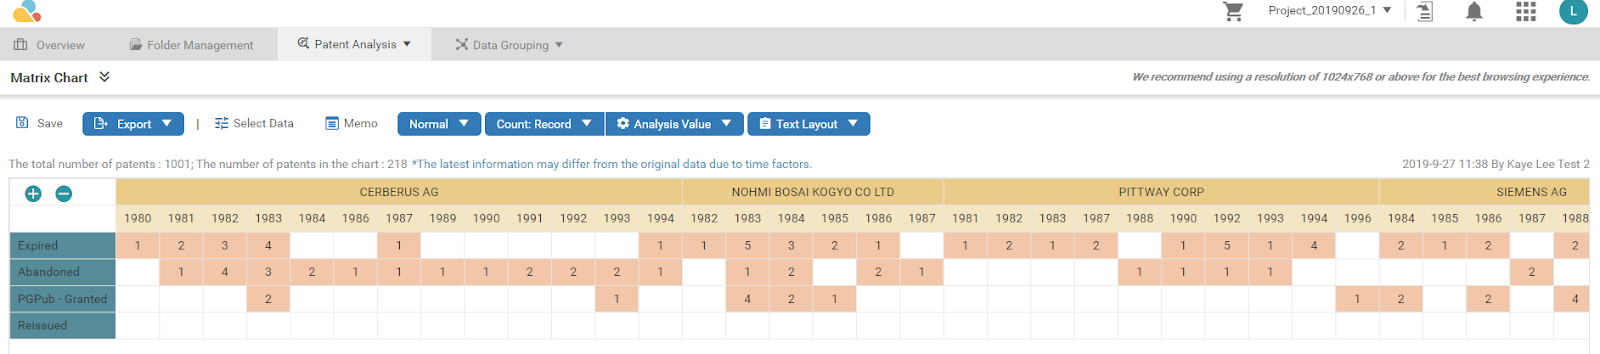
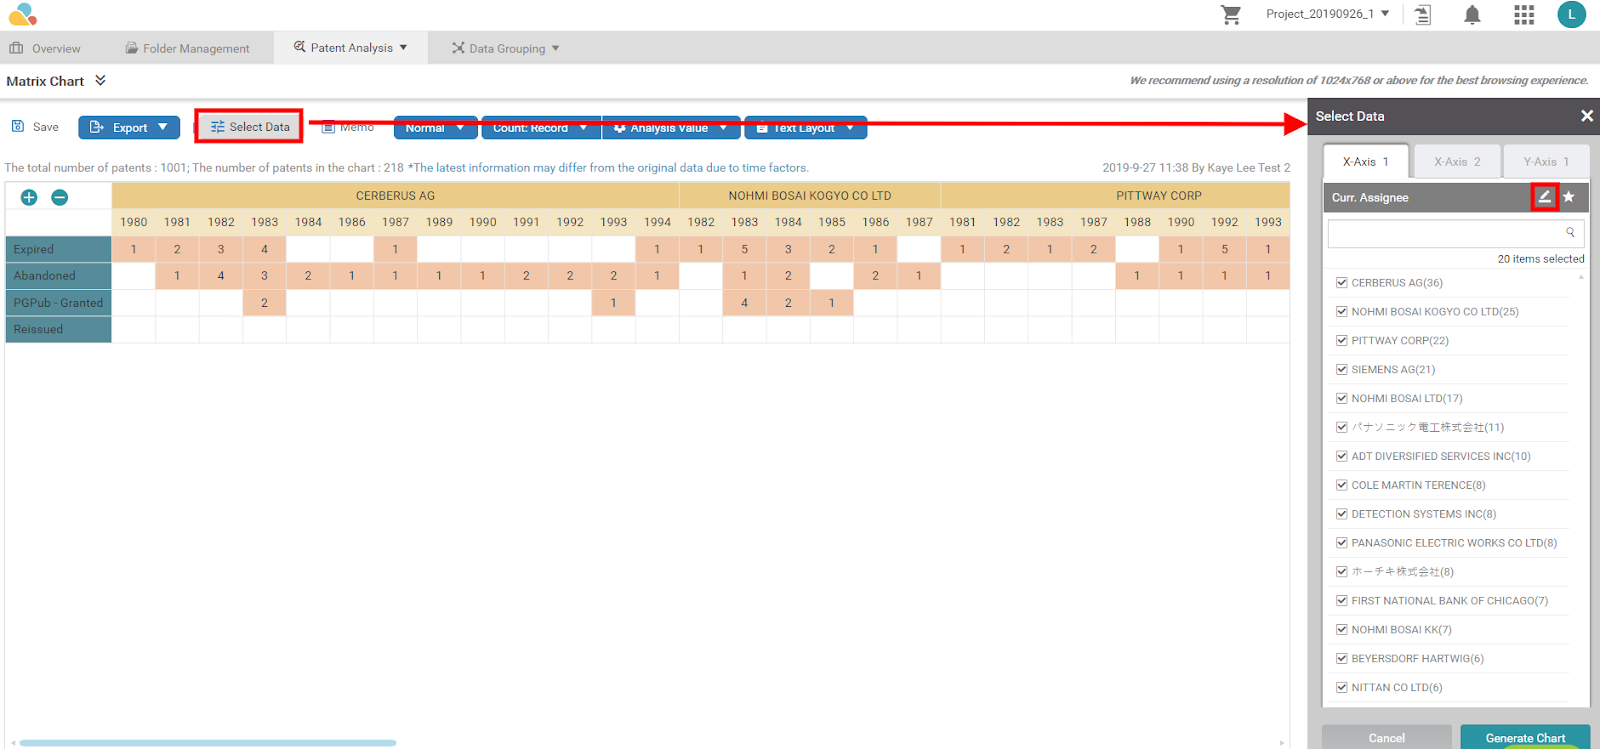
Depending on the amount of data, it may take a few minutes to process and display the Patent Matrix. An example of the Patent Matrix is shown below. The X-Axis shows the Assignee and Application Year, while the Y-Axis shows the Legal Status. The orange cells indicate the patent count for the corresponding X and Y combination.
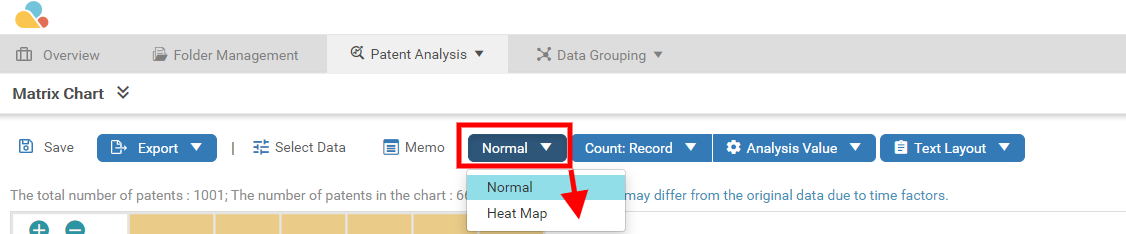
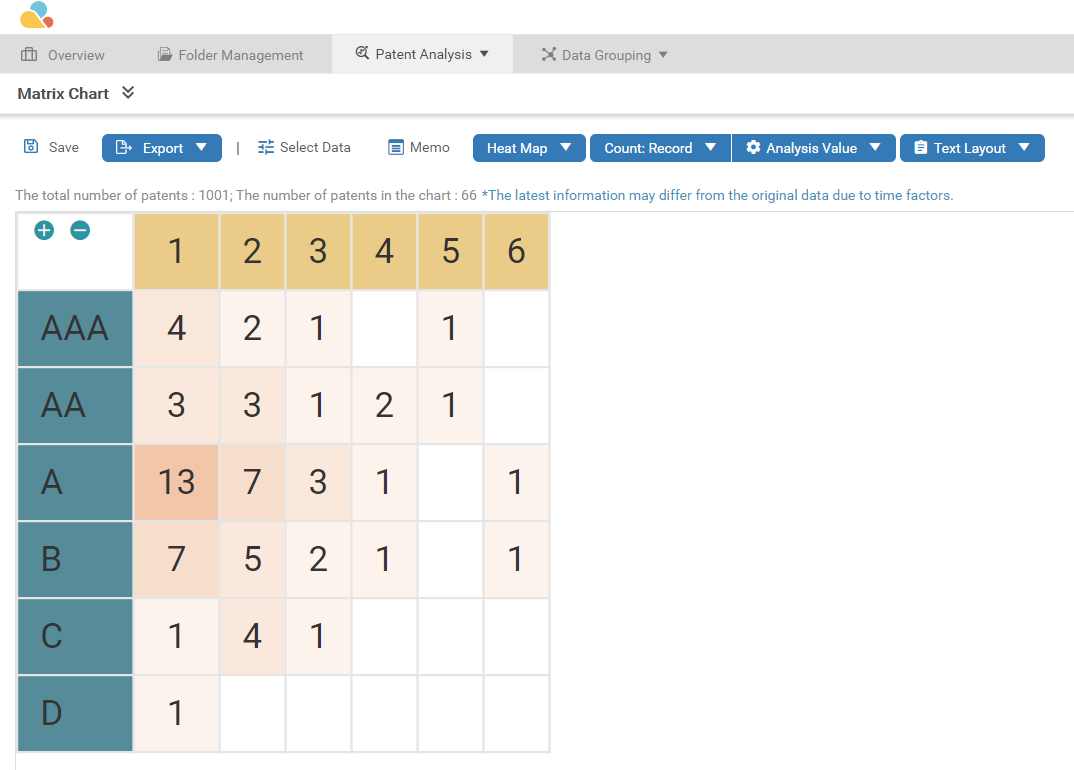
A Heat Map view in Matrix is also available. Simply click on the Normal (default) dropdown and select Heat Map.
Users can share a chart with the members in their project by following the steps below:
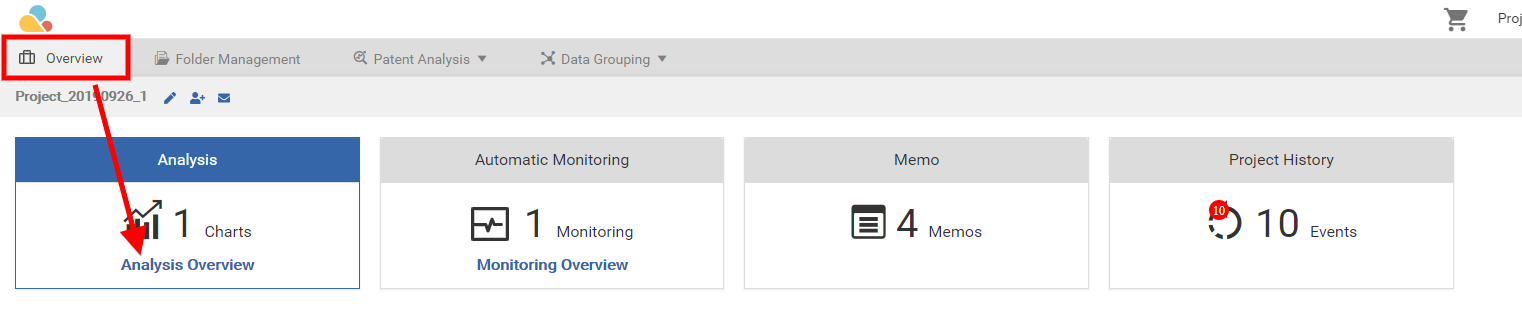
- Go to Overview and in the Analysis box, click on Analysis Overview.
- Locate the chart title to be shared. Hover the mouse on the title to see icon shortcuts for Edit and Delete.
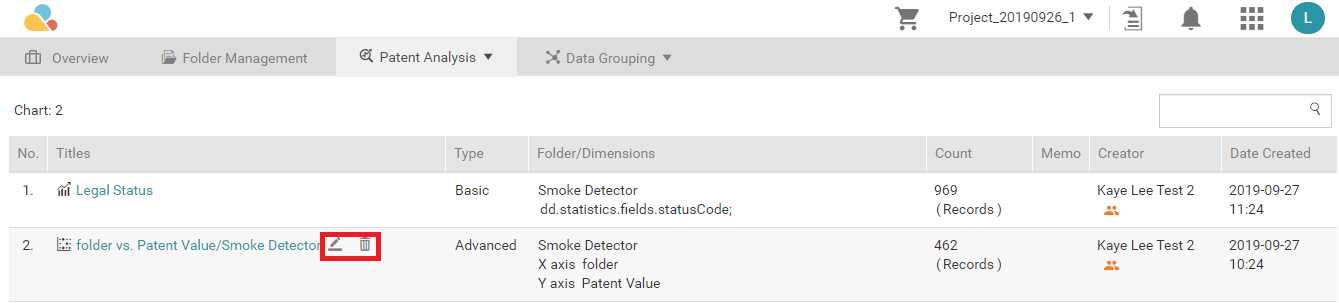
- Click on the Edit
 icon and in the Share field, click On.
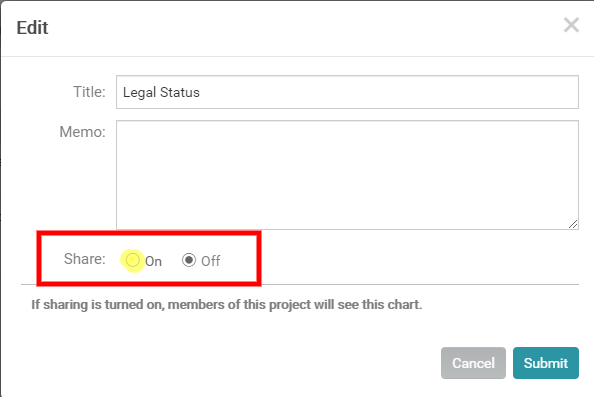
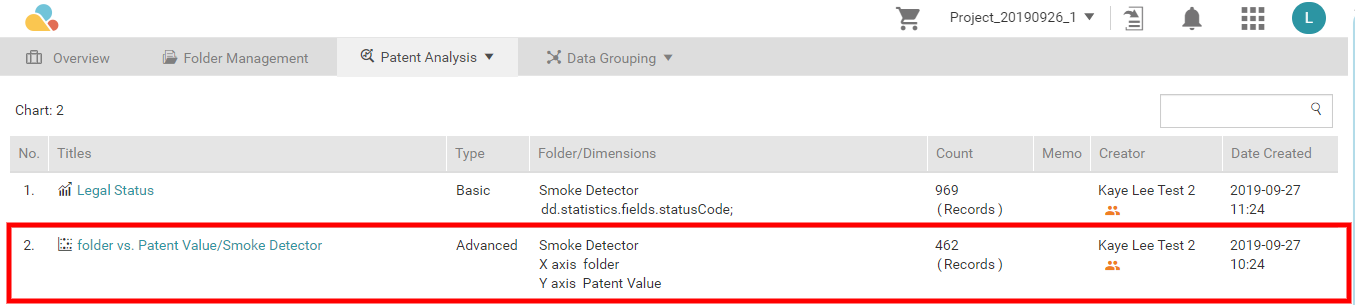
- Go to Overview and refresh the webpage. This will then be reflected as an additional record within Analysis.
Renaming a Field in the Patent Matrix (Only for Data Fields under Party)
To modify a name in Analysis, click on Select Data then click on the Rename  icon.
icon.
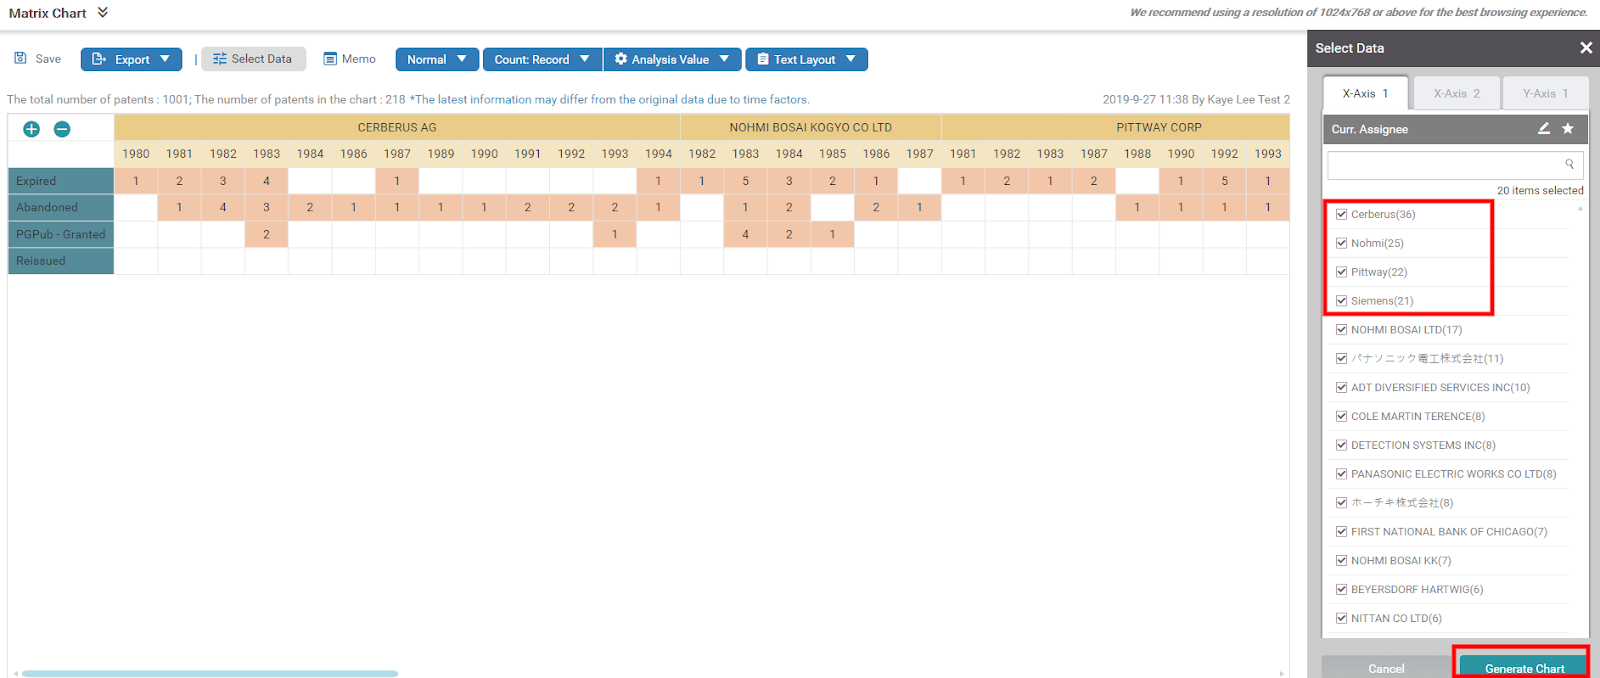
Change the names on the field boxes then click Confirm.
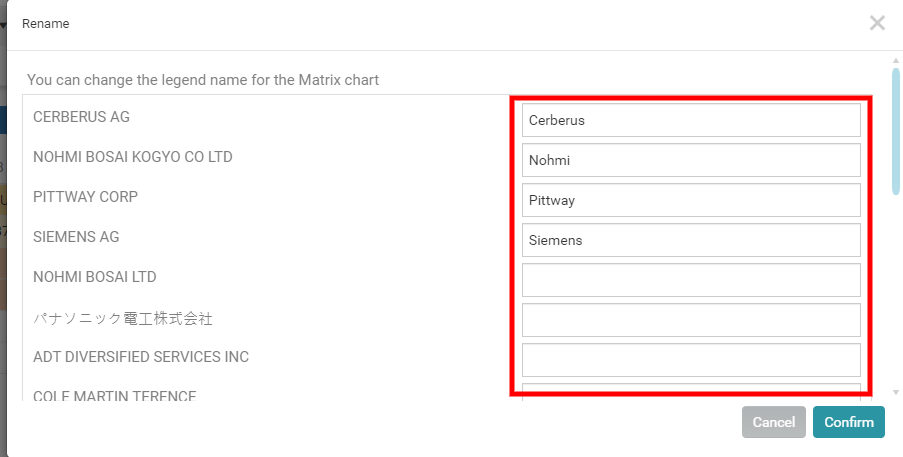
This will automatically reflect in the Select Data panel. Once correct, click on Generate Chart.
Patent Assignments with the Patent Matrix
To perform an analysis using assignment data, please follow the steps below:
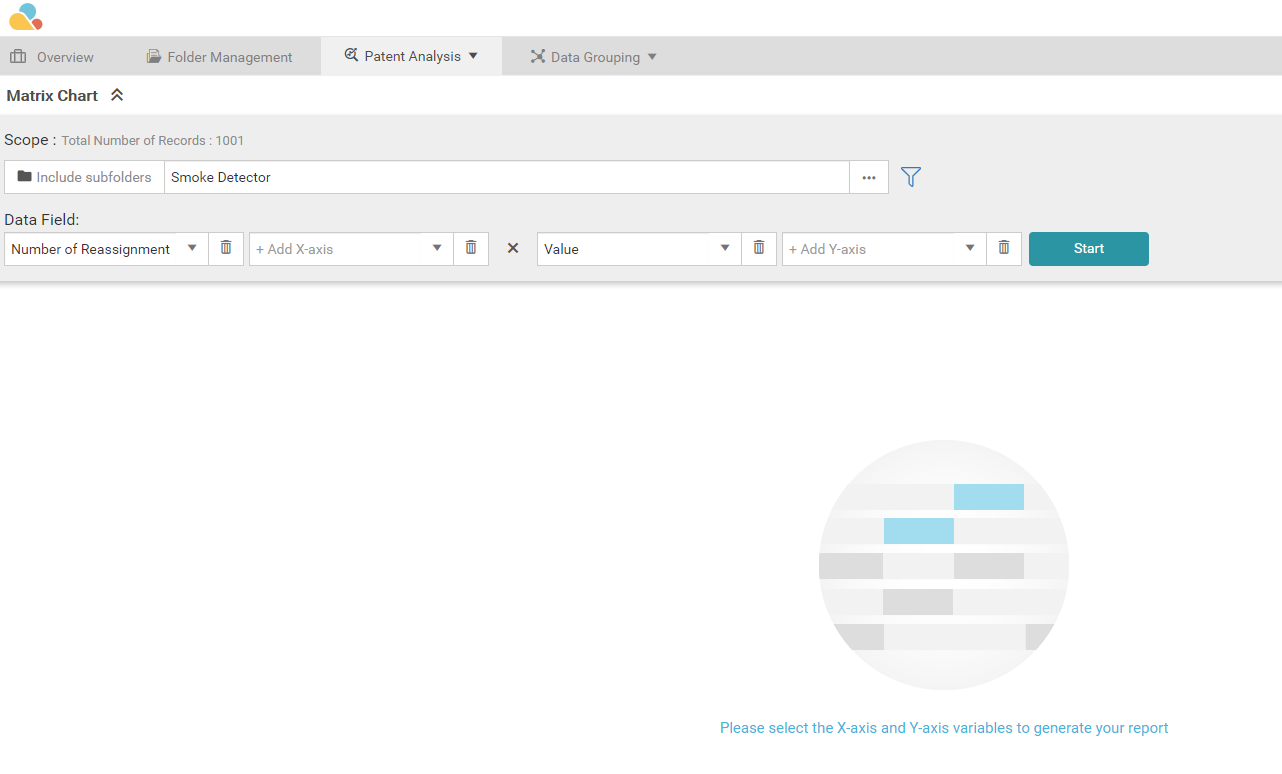
- Go to the Advanced Analysis page on the Patent Analysis tab.
- For the X-axis, select a data parameter. In this example, Number of Reassignments has been chosen. For the Y-axis, Value has been selected. Click on Start.
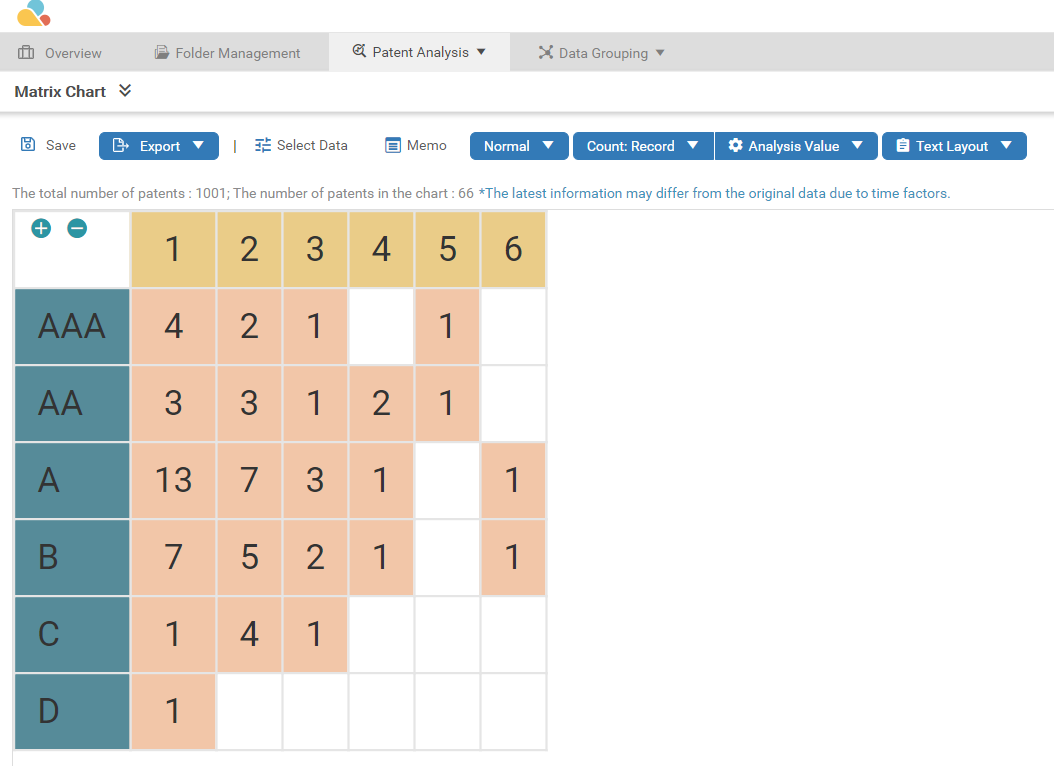
- After a few seconds, an analysis of the chosen parameters will appear. In the example below, there is a discrepancy in the total number of patents vs. number of patents in the chart. This could be due to some patents having zero reassignment or having no Value ranking.
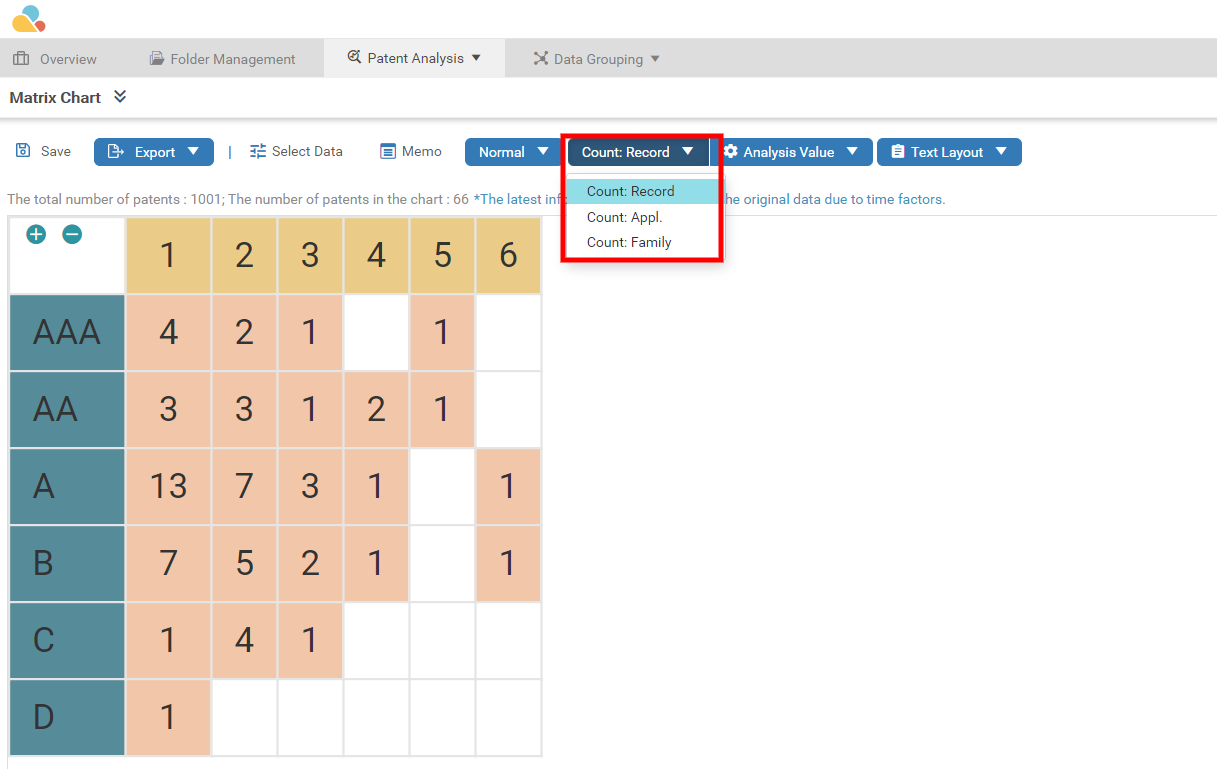
Family and Application Counts
In the Patent Analysis section, it is possible to sort and count patents by family and applications. Follow the steps below to perform the count function:
- Go to the Advanced Analysis page on the Patent Analysis tab.
- Create a Matrix chart and view the chart.
- While viewing the chart, click on the Count dropdown. As seen in the image below, users can select what to count by.
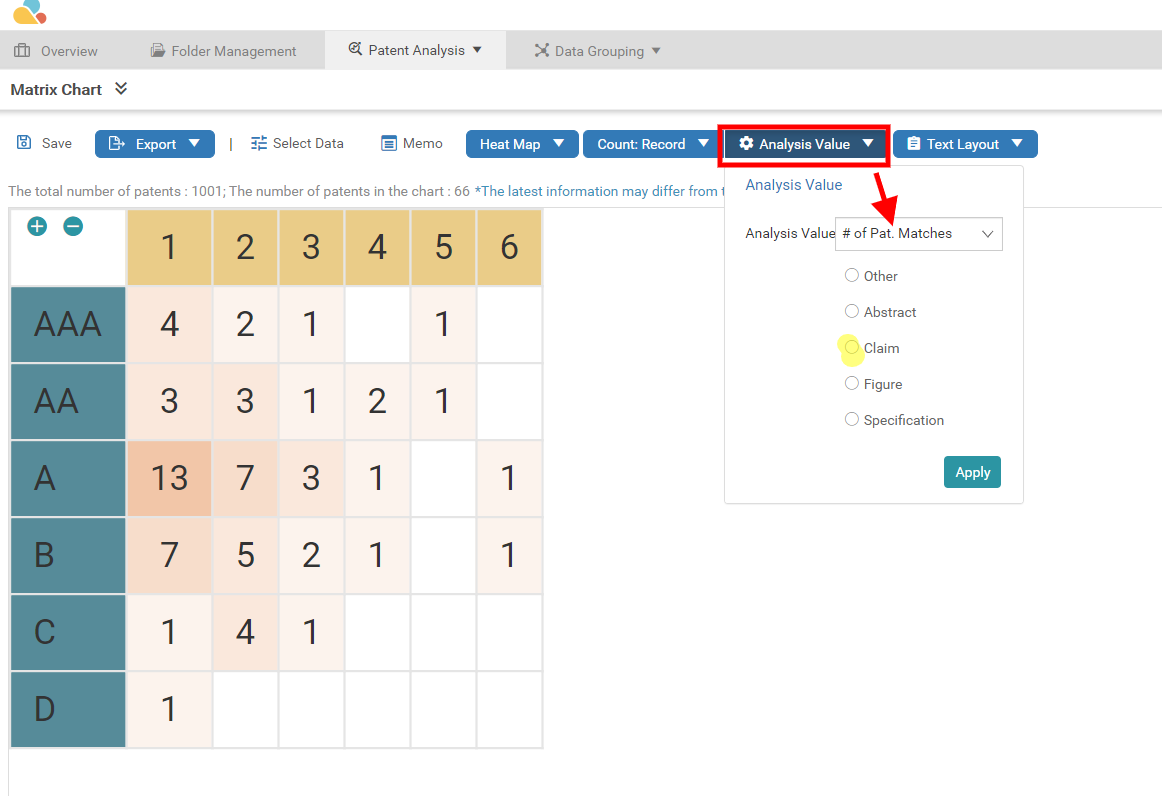
Analysis Value
In the Patent Analysis section, it is possible to analyze the matching items with the patents added to the folders. Follow the steps below to perform this action:
- Go to the Advanced Analysis page on the Patent Analysis tab.
- Create a Matrix chart and view the chart.
- While viewing the chart, click on the Analysis Value button, and a menu will drop down. As seen in the image below, users can select whether to count by patents, by matching patents, or by matches as to why the patents were added.